Following the first experiment with the iCOMOX sensor onboard a Cessna 172 Seaplane, three new tests, onboard commercial jets, have been performed. In two of the three cases there was no turbulence.
The aircraft in question are: Boeing 777 300 ER, Airbus A320 and the Airbus A350 900. In all cases the experiment was performed in the forward section of the fuselage.
It is important to remark that the iCOMOX sensor that has been used is a passive device that does not emit any EM radiation and does not jeopardize the sefatey of the flight. In essence, it is like a cellphone, operating in flight mode.
The goal of these experiments is not to perform an exhaustive comparison of Cabin Environment quality of various aircraft. The reason for this is obvious. Aircraft experience a wide variety of flight conditions, weather being the most prominent and the most variable. The comfort of a cabin in an aircraft doesn’t depend solely on its design, it also depends on the external conditions the aircraft experiences as well as the phase of the actual flight. Not to mention piloting skills.
The goal is to merely illustrate how complexity can be used to provide a comprehensive index that allows to confront aircraft of different types and sizes and in different phases of the flight.
Test 1
Aircraft: Boeing 777 300 ER
Position in aircraft: Seat 6A (location indicated in scheme below)

The iCOMOX sensor was positioned as in the photograph, underneath the window. On the other flights, the setup was very similar.

Vertical accelerations (Ay) and sound level have been recorded. Only vertical acceleration has been consideed), The duration was close to two minutes. The plots below illustrate the actual acceleration signal as well as the corresponding complexity (C).

At the time of minor jolts, peaks in complexity arise. The maximum value is around 40.
A modified complexity metric, Cn3, has also been computed. Although it is different in character, it too shows one major peak in proximity of the strongest jolt.

Test 2
Aircraft: Airbus A320
Position in aircraft: Seat 7A (location indicated in scheme below)

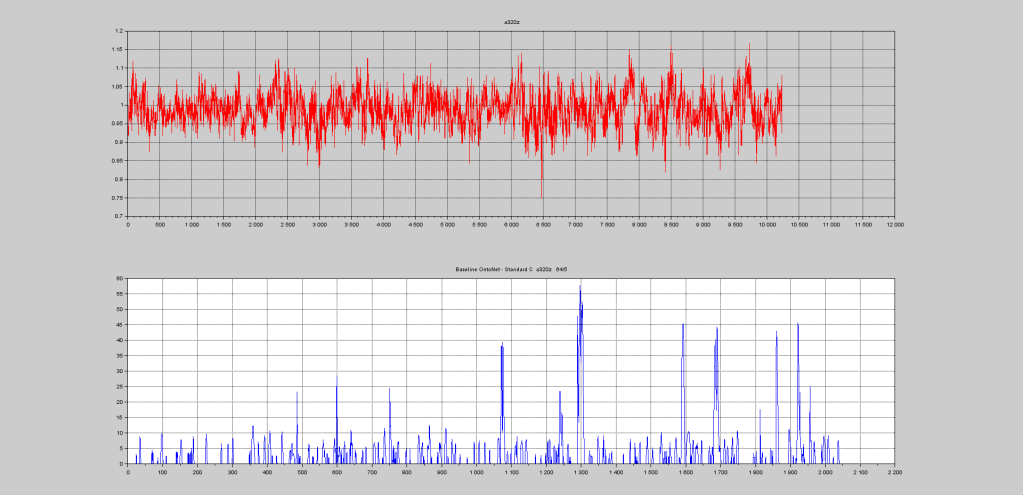
In this case mild turbulence was present during the experiment. Only the standard complexity is reported.

Complexity peaks in this case reach a value of approximately 60, almost 30% higher than during a turbulence-free flight with the 777.
Test 3
Aircraft: Airbus A350
Position in aircraft: Seat 3F (location indicated in scheme below)

The following experiments have been performed during take off and landing. Since the iCOMOX used in the experiment must be connected to a computer in order to record the data, and because computers must be switched off during take off and landing, accelerations have been measured using a smartphone App. The App, always in flight mode, looks as follows:
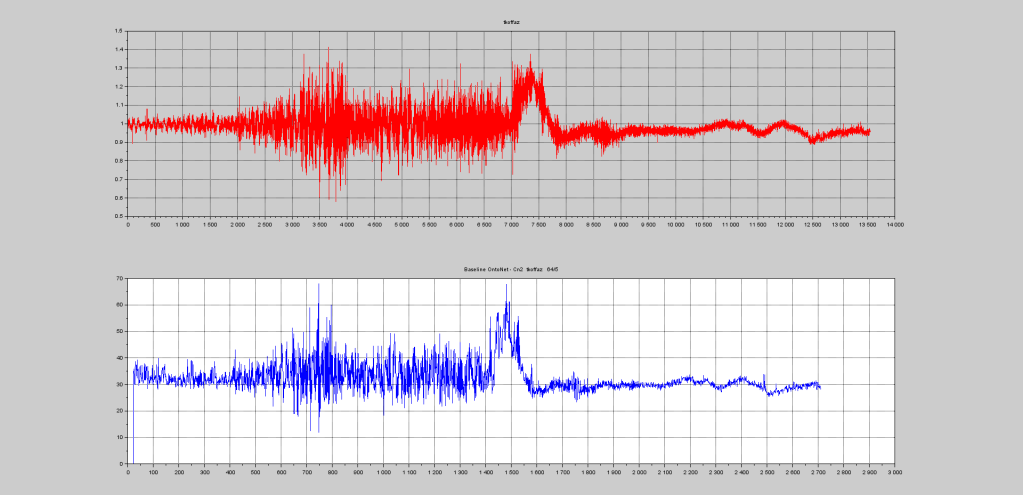
Vertical acceleration has been recorded throughout the first two minutes of the flight, including the take off run. Take off takes place at step 7000, exactly in the middle of the chart. Peak acceleration after take off reaches 0.3 g. Similar levels are recorded during the actual take off run. Complexity is highest during the take off run, indicating that this is not a phase of high cabin comfort. Once the aircraft is airborne, complexity goes down to zero almost immediately. The minor peak in complexity on the far right of the chart corresponds to the landing gear being retracted.

The Cn2 complexity metric mimics the actual acceleration signal quite closely.

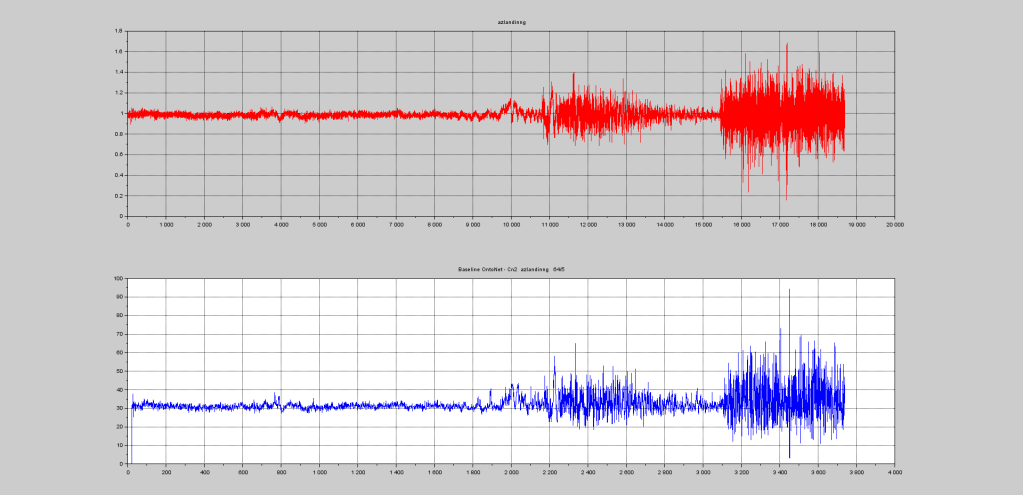
Landing. The last three minutes of flight have been recorded. The arrow indicates the moment when langing gear is dropped. Complexity reflects this with a minor peak. The actual landing gives rise a vertical acceleration of 0.1 g (the pilot was really good in this case!). However, when aerobrakes and thrust reversers are deployed, vibrations increase significantly. Again, complexity relfects this quite eloquently.

Values fo complexity are around 40, just like during take off.
The Cn2 metric, once again, offers a profile very close to that of the actual acceleration.

These simple experiments illustrate how complexity analysis of acceleration and acoustic data (see our previous blog) data may be combined in order to produce a single Cabin Environment quality or comfort index. This index may be computed during various phases of the flight and may be used to confront passenger comfort for different aircraft. However, given the multitude of conditions in which aircraft operate, in order to perform an exhaustive study it would be necessary to consider a significant number of aircraft and, most importantly, deploy more sensors in the cabin (8-12). This, however, would require collaboration from airlines as well as manufacturers.


Very interesting blog. It will be worth looking into the ride and comfort of cars. For road vehicles, there is plenty going on within the small frequency range (~30 Hz).
LikeLiked by 1 person