
In the framework of the European Horizon Project AFFIRMO, grant 899871, Ontonix has developed a Risk Stratification tool which provides a probability score of patient hospitalization within a 1-year period. The specific aim of the AFFIRMO project is to implement and test the effectiveness of an integrated patient-centered holistic care pathway for the management of older patients with AF and multimorbidity, which will facilitate cooperation among different health disciplines and promote a shared decision-making processchronic conditions.
The work has been performed within a work package led by the Karolinska Institute in Stockholm, where the tool is being tested.
Patients that have been analyzed belong to the following categories:
- Age group – 65-74, 75-84, 85+
- Education – elementary, high, university
- Polypharmacy – no, yes, excessive
- Civil category – single, not single
- Income category – very low, low. medium, high, very high
- Sex – male, female
Each patient is affected by one or more of the following diseases:
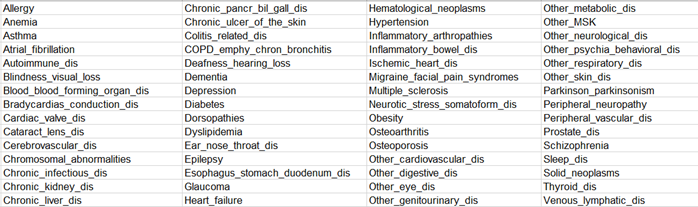
The presence of a given disease is indicated with “1”, otherwise “0” is introduced. As a result, each patient belongs to a given category and is characterized by a vector of 0s and 1s. In addition, since the data used to test the tool is historical data, for each patient the outcome is also available, namely 0 (not hospitalized) and 1 (hospitalized within the first year).
In essence, all patients, regardless of category and diseases, can be split into two groups – those with outcome = 0 and outcome = 1.
For each patient category, a separate reference subset is extracted for outcome 0 and 1.
The testing proceeds as follows:
Each randomly selected patient, for whom the outcome is considered unknown, is introduced into each reference set and his/her similarity with each set is computed. The outcome is then determined on the basis of greater similarity with the two reference sets (S_0 and S_1). In other words, the outcome (0 or 1) is that of the reference set with which a given patient is more similar.
Based on the difference between the two measures of similarity, i.e. d=S_0-S_1, a percentage score is determined using a proprietary score function. An example of score (%) is illustrated below for a group of 14 patients:

The above patients have all been verified as Outcome = 1 cases, i.e. all have been hospitalized within a 1-year period.
An initial test has been performed on 800 patients with Outcome = 1 and 1650 with Outcome = 0. Further testing of the tool is currently under way, however, preliminary results are as follows:

With 2450 patients, the overall hit ratio is 91.5%. The mis-classified cases have, however, a score close to 50%, meaning that a given patient could, potentially, be placed in the other outcome group.
The Area Under the ROC Curve (AUC), illustrated below, is 0.86, which is excellent.

Results obtained from a similar batch of 3100 patients confirm the above tendencies, i.e. approximately 92% success rate.
The tool may be adapted to process other types of data, such as that collected from pacemakers/ICDs implanted in patients with cardiac disorders, providing an improved and patient-specific post-implant care and monitoring.

Pingback: Processing Discrete, Uncorrelated Data – Artificial Intuition