
“Climate is the long-term weather pattern in a region, typically averaged over 30 years. More rigorously, it is the mean and variability of meteorological variables over a time spanning from months to millions of years.” (from Wikipedia). In other words, climate does not change from one year to another as we’re talking of long term variations in means and standard deviations of variables such as temperature, humidity, atmospheric pressure, wind, and precipitation and these are not easy to appreciate without proper analysis.
As the climate on Earth is driven by elements such as the Sun, the atmosphere or the oceans, its dynamics is highly complex. Even the Lorenz equations, describing a simplified atmospheric convection model, develop extremely complex behaviour. Also the variations in eccentricity, axial tilt, and precession of the Earth’s axis affect the climate over thousands of years – see the Milankovitch cycles.
So how can one “measure the dynamics” of climate? One way is to measure and track its complexity, which has the ablity to condense even immense quantities of data into one single, systemic indicator. To that end, a simple experiment has been performed considering daily average temperature readings in twenty locations, as indicated in the map below.

Data from the above locations is arranged in a moving window of two weeks, and its analysis is performed automatically every day, recording the resulting complexity. Results for the past 150 days (January – May, 2024) are reported in the plot below.
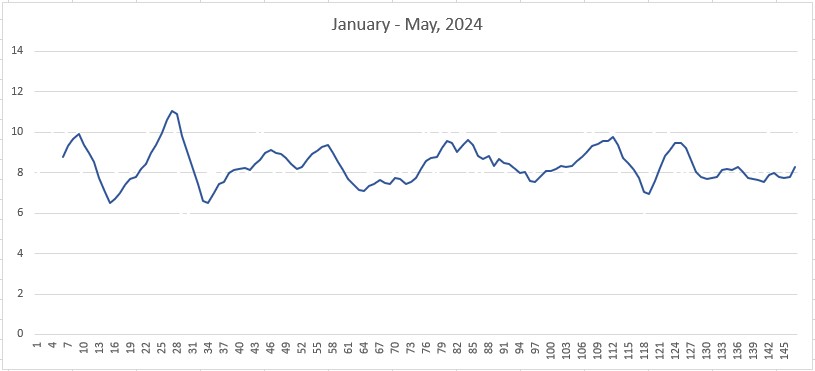
As expected, complexity oscillates, reflecting – even though based on an extremely simplified dataset – the intricate dynamics of global weather system. One major conclusion may be drawn from the analysis:
As complexity oscillates, its mean value shows no drift or appreciable changes in mean value. This points to a system that oscillates around a certain condition of ‘equilibrium’ and one which is stable. Increasing complexity could point to a sort of runaway, but it is too early to say. The Earth is formidable machine that uses a changing and intricate climate to keep a constant mean temperature over periods of thousands of years. The evolution of climate complexity could be a way of proving just how efficient and perfect this machine is.
To be sure, the analysis spans only five months, and certainly many more locations could have been contemplated. However, even this crude experiment shows that complexity offers a novel means of describing and measuring the intricacies of the global weather system. Analyses such as the one described in this blog can be done on a global as well as local level, with any desired degree of granularity and incorporating other variables in the process, beyond just temperatures.
Evidently climate does change. It has to. Nothing in Nature is static and everything in the Universe is an interplay of processes that involve the flow and transformation of energy, matter, and information. The reason why so many things appear to be stable is because their equilibrium is dynamic.

Pingback: Complexity and Measuring the Climate – an Update – Artificial Intuition