
What is Industry 4.0? To put it briefly, the idea is to collect a lot of data from the factory floor using a bunch of sensors, and use it to make better decisions, achieve better efficiency and identify anomalies.
Today, many factory/plant managers think that Artificial Intelligence is able to solve all of their problems. Yes, AI can solve many problems, but it cannot solve the really nasty ones. But what is a nasty problem? A problem is nasty if:
- It is systemic in nature
- It involves hundreds or thousands of dimensions
- It is multi-disciplinary
- It happens very rarely
- The consequences of failure are catastrophic
- You don’t even know it is there (are we under attack?)
Conventional analytics is unable to treat such problems. Such problems are certainly out of AI’s reach too as there are not enough examples from which to learn. And then there is the issue of explainability – sometimes AI cannot explain why it arrived at a specific solution. This can be an important issue to consider. If you cannot explain why you have a certain solution, or you simply guess it, you learn nothing, no new knowledge is gained.
Below is a small example which shows how a nasty problem can be solved in minutes, without any Machine Learning.
Let us consider an example of a blast furnace, where the following 220 variables are measured and recorded on a daily basis (this data is always available):
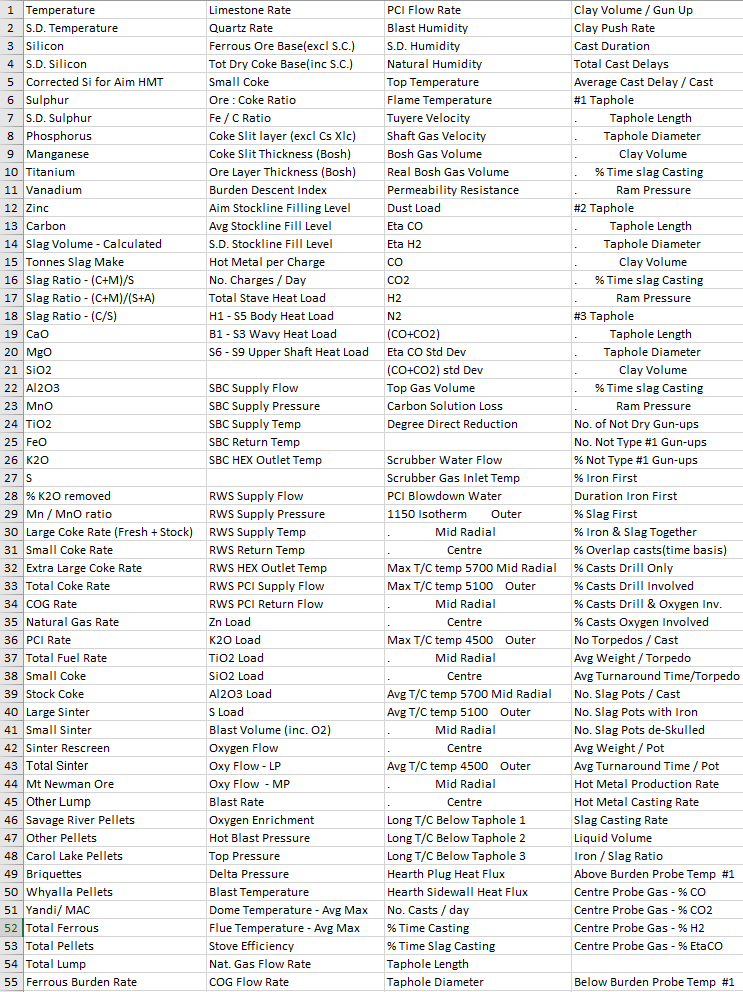
The problem is the following: During Q1 and Q2 the production quality is satisfactory, while during Q3 and Q4 it is not. The question is why?
First of all, in order to appreciate the nature of the problem, let’s see the Complexity Map of the blast furnace in the Q1 and Q2 period (click image to enlarge):
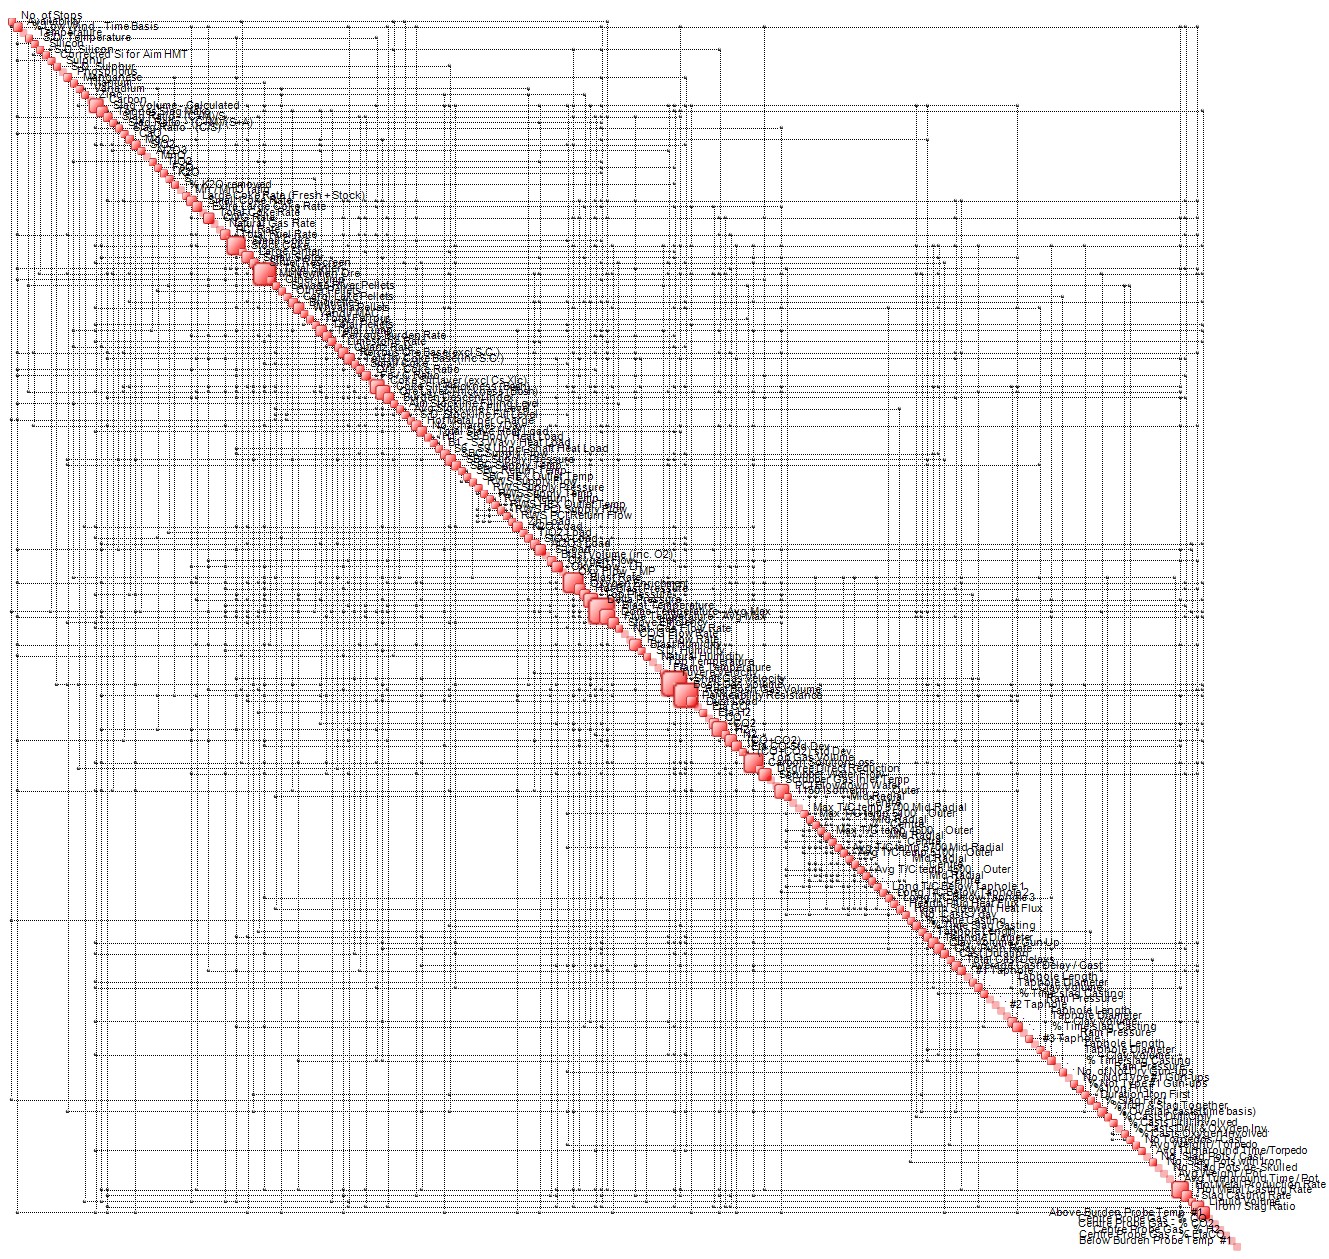
An enlarged detail is shown below.
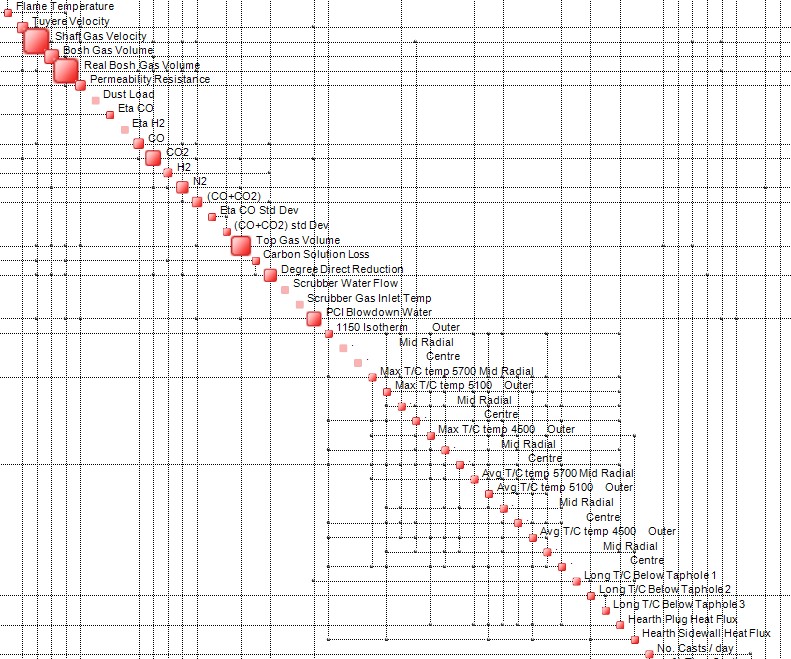
This map contains more than 1400 interdependencies between the 220 variables. These reflect the underlying physics, constraints, process settings, etc.
In order to answer the question as to why the loss of productivity, we resort to OntoTest™, a QCM-based tool that compares two data sets (scenarios). Once the data relative to the first (Q1+Q2) and second (Q3+Q4) period is loaded, the two corresponding Complexity Maps are produced, as shown in the main GUI below. The red map is the reference scenario (Q1+Q2).
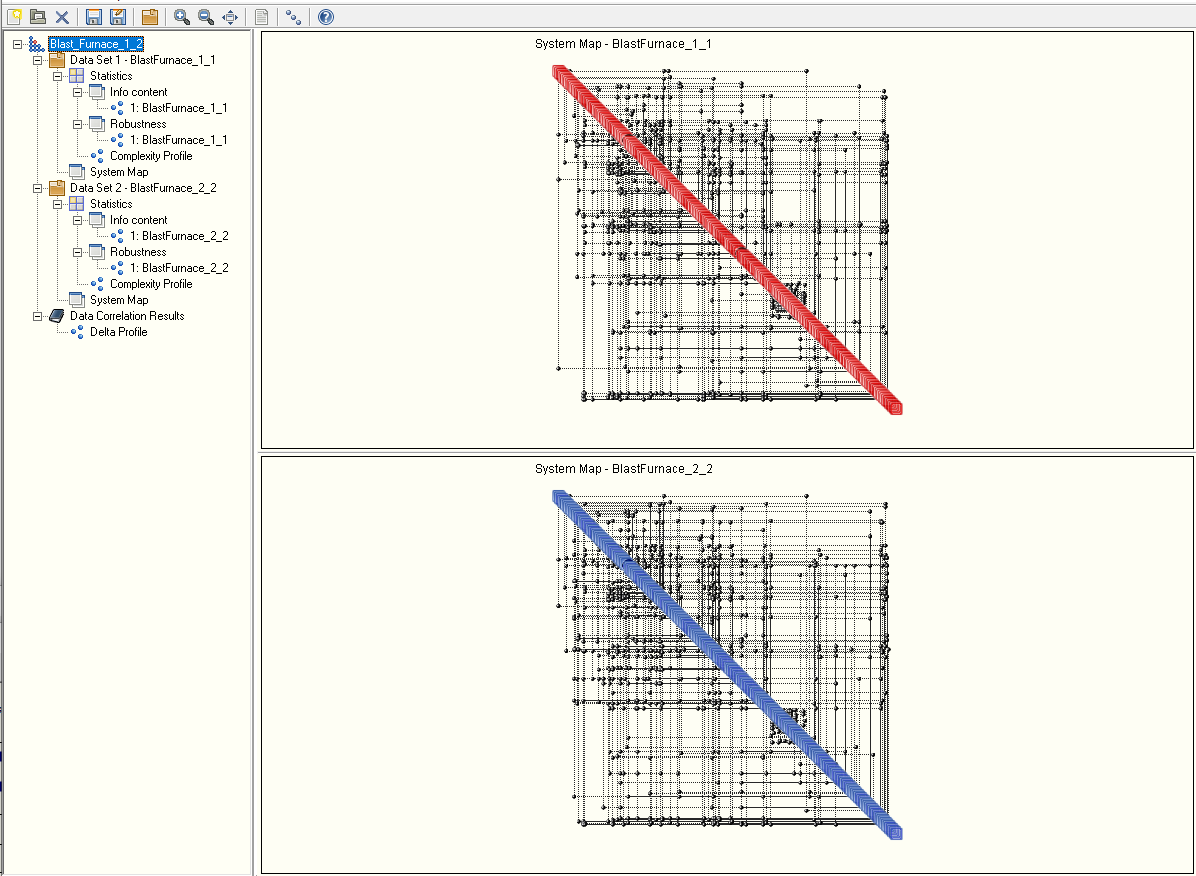
The two complexity maps are compared and a degree of similarity is computed. In the case in question it is:
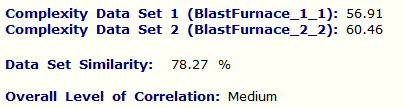
In other words, the “distance” between the two cases is approximately 22%. The question is where did this 22% go? The answer lies in the chart below (only the top portion is shown):
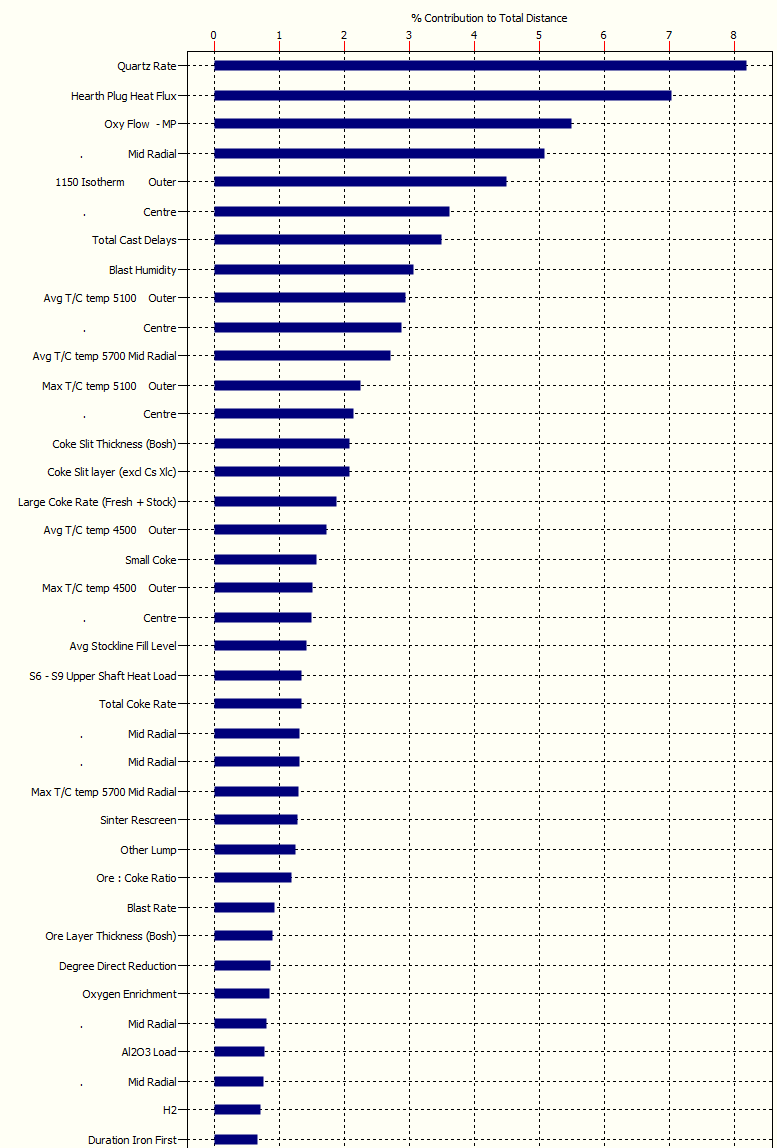
The variable “Quartz Rate” is responsible for 8% of the 22%. Follows “Hearth Plug Heat Flux” with 7% and Qxy Flow with 5.5%. In essence, already the top 8 variables in this chart explain approximately 40% of the 22%. With a few more, one reaches 50%.
What this means is that with a single computation, one may determine in a matter of minutes why a complex plant malfunctions. With no need for Machine Learning, no need to construct training sets, no learning bias. All it takes is sensors (but that’s Industry 4.0, right?) and the ability to store their outputs. And QCM-powered Artificial Intuition.

Pingback: The QCM, Degradation Index and Condition-Based Maintenance. – Artificial Intuition