The complexity of modern products is increasing rapidly. But high complexity is a prelude to vulnerability. It is a fact that excessive complexity leads to inherently fragile situations. Humans perceive this intuitively and try to stay away from highly complex situations. But can complexity be taken into account in the design of products? The answer is affirmative. Recently developed technology, which allows engineers to actually measure the complexity of a given design or product, makes it possible to use complexity as a design attribute. Therefore, a product may today be designed with complexity in mind from day one. Not only stresses, frequencies or fatigue life but also complexity can become a design target for engineers. Evidently, if CAE is to cope with the inevitable increase of product complexity, complexity must enter the design-loop. Before going into detail, let us take a look at the underlying philosophy behind a “Complexity-Based CAE” paradigm. Strangely enough, the principles of this innovative approach to CAE have been established in the 14-th century by Francis William of Ockham when he announced his law of parsimony – “Entia non sunt multiplicanda praeter necessitatem” – which boils down to the more familiar “All other things being equal, the simplest solution is the best.” The key, of course, is measuring simplicity (or complexity). Today, we may phrase this principle in slightly different terms:
Complexity X Uncertainty = Fragility
This is a more elaborate version of Ockham’s principle (known as Ockham’s razor) which may be read as follows: The level of fragility of a given system is the product of the complexity of that system and of the uncertainty of the environment in which it operates. In other words, in an environment with a given level of uncertainty or “turbulence” (sea, atmosphere, stock market, etc.) a more complex system/product will result to be more fragile and therefore more vulnerable. Evidently, in the case of a system having a given level of complexity, if the uncertainty of its environment is increased, this too leads to an increase of fragility.
INTRODUCTION
Complexity is a newly discovered and fundamental property of all systems. Its importance is comparable to that of energy. Like with all things in life, a minimum dose of complexity is necessary in order to function. Too much can cause grave problems. A good example is cholesterol, an illness of our modern times. It gives no symptoms and when not monitored may severely endanger one’s life. Fortunately, not only we know of the existence of cholesterol, we also know how to measure its level and how to control it. The same may be said of the complexity of any system. Until recently it was not possible to measure complexity. Today not only are we able to recognize the existence of the problem, we are also able to actually measure the complexity of practically any system.
Complexity cannot grow indefinitely. The laws of physics ensure that every system can sustain its own specific maximum amount of complexity before it becomes unmanageable and before it loses integrity. This limit is known as critical complexity. In the proximity of this threshold systems become unstable. Close to critical complexity a system loses resilience, becomes fragile and vulnerable. Prediction of performance becomes unreliable and the system is unprepared to face extreme events (the so-called Black Swans).
High complexity leads to many adverse consequences which are well known:
- Low profitability
- High inefficiency
- Limited growth potential
- The business/system is unsustainable and fragile
Because we are all confronted with complexity on a daily basis it has become almost a matter of common sense to opt, with all things being equal, for the least complex solution when given the chance to make a choice. Many of our every-day decisions are instinctively based on a minimum-complexity approach. This is why engineers prefer a simpler solution to a highly complex one. Making decisions in a highly complex situation requires more knowledge and resources and is generally more difficult. From a practical standpoint high complexity implies:
- surprises are more likely
- high interdependency, numerous constraints
- high uncertainty
- multiple points of failure
TODAY complexity MAY BE MEASURED Our technology allows engineers to actually measure complexity and to use it as a design attribute, like stresses, displacements or temperatures and to drive it to prescribed target values. This opens new avenues for the CAE of the future.
COMPLEXITY RATING OF A SYSTEM
Just like in the mentioned example of cholesterol, the state of health of a generic system is proportional to the difference between the current and limit (critical) value of its complexity. A healthy system functions at a safe distance from its critical complexity. Like with your cholesterol levels, or the balance of your bank account, so with complexity you should know its current value as well as the limits you can safely reach and sustain.
Because everything in life is relative the mere value of complexity of a system means little until the corresponding critical limit is specified. For this reason, it is not necessary for a system to be large to say that it may be highly complex. It’s how close you function to your own critical complexity that matters not the value of complexity itself.
Based on how close to its critical complexity a system functions it is possible to issue a complexity rating. We may distinguish five categories of system complexity. Each level is assigned a number of stars ranging from one to five – a five star system being the healthiest:
System complexity is very high. The system is globally close to its critical complexity. It is unsustainable and very fragile. Exposure is very high and the system is highly inefficient and very difficult to manage. It is impossible to forecast performance reliably.
Rating: 1-star
System complexity is high. The system is highly complex and difficult to manage and control. Exposure is high and so is inefficiency. The system is fragile hence vulnerable.
Rating: 2-star
System complexity is medium. The system is fairly robust. It is manageable and controllable. Performance predictability is acceptable. Exposure is moderate.
Rating: 3-star
System complexity is low. This indicates a robust structure. Predictability is high, exposure is low. System sustainability and efficiency are quite high.
Rating: 4-star
System complexity is very low. Structure is very strong. Exposure is very low. The system is manageable and it is possible to make credible forecasts as to performance.
Rating: 5-star
HOW IS ROBUSTNESS MEASURED?
The fundamental step in measuring the robustness of a system is the synthesis of the so-called System Map. his is built based on the user’s raw data and using a patented approach. System Maps are of fundamental importance towards the understanding of the behavior of a system in that they indicate which variables are related and which are particularly important. An example is indicated below.
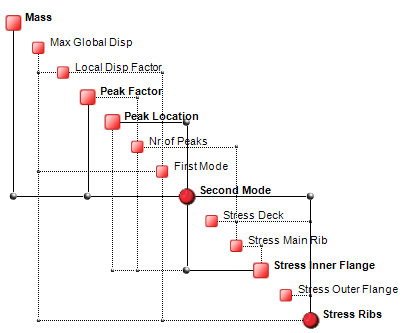
Figure 1. Example System Map synthesized by processing Monte Carlo Simulation results obtained with a commercial FE solver.
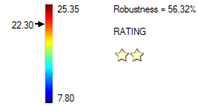
Maps may be navigated interactively using MAPVIEW – a free App available online here. Once the map has been obtained, the complexity of the system may be computed, as well as the corresponding upper (critical complexity) and the lower complexity bounds. Complexity is a function of the map’s structure (topology) and the total amount of entropy within the system. It is the value of complexity with respect to the lower and upper bounds that determines robustness and the corresponding rating. Examples of 5 different systems, having ratings of 1 through 5, are shown below. It is clear how systems functioning in the proximity of the lower complexity bound are deterministic in nature, while those which function close to the upper bound (critical complexity) are more uncertainty-dominated and therefore less predictable.

Figure 2. Examples of 1 through 5-star systems and typical scatter plots.
In each of the above cases a typical scatter-plot is also illustrated, showing how systems with a low robustness are less predictable and controllable.
But what does robustness measure? The way we have designed it, robustness measures how well the Structure Map is able to retain its topology in the face of disturbances (which can be endogenous or exogenous). Since the topology of the map describes the flow of information within the system it reflects the system’s functionality. For this reason we often refer to this measure of robustness as topological robustness.
HOW IS ROBUSTNESS COMPUTED?
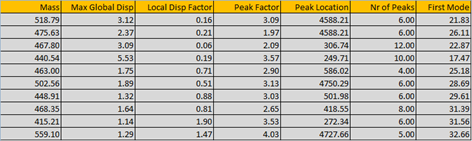
Robustness and system complexity are computed based on sampled values of design variables and/or system outputs. These should be arranged in a rectangular array, in which the columns represent the variables while the rows stand for samples. The list below, which is incomplete, indicates which variables may be used to assess a system’s robustness and complexity.
- Dimensions
- Material properties
- Initial conditions
- Boundary conditions
- Stresses
- Displacements
- Accelerations
- Frequencies
- Temperatures
- Etc.
A minimum of 10 samples of each of these parameters should be used. An example of such an array is shown below.
There is a multitude of ways to obtain similar data:
- Monte Carlo Simulation (MCS)
- Design Of Experiments (DOE)
- Parametric/sensitivity studies
- Optimization
- Time-domain simulation (crash, CFD)
- Non-linear static analysis
In the case of MCS, DOE, Optimization or parametric studies, each iteration provides a row in the data array. In the case of time-domain simulations, one may take values at each time-step while in the case of non-linear static analysis each iteration will provide the corresponding data. Evidently, in these last two cases, only output variables (stresses, displacements, etc.) will vary while the design variables will remain constant. The more samples are considered the more relevant will the results be.
IDENTIFYING THE SOURCES OF FRAGILITY
The most important result of a Design for Resilience analysis of a system is the so-called Complexity Profile which provides a breakdown of the total system complexity as described by the user’s data. Let us consider the case below, which exhibits poor robustness:
The corresponding Complexity Profile, illustrated below, shows how the design variables which drive complexity – and ultimately robustness – are the ones at the top of the bar chart, i.e. “T Outer Flange”, “Dimension Fraction” and “Radius”. These three variables alone control approximately 40% of the system’s complexity, hence robustness. In particular, it is the variability of these parameters – due to tolerances, imperfections, etc. – that must be reduced if the robustness of the system is to be increased.
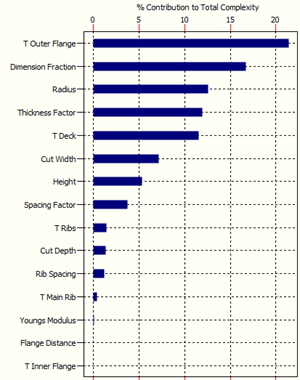
Figure 3. Example of Complexity Profile of a mechanical system
GETTING MORE VALUE FROM YOUR DATA ON ENTERPRISE SCALE
OntoNet™ forms the backbone of the D4R system and together with MAPVIEW™ may be integrated into any IT infrastructure or Simulation Data Management system. This means that every engineer within your organization will be able to measure and manage robustness and design complexity.

OntoNet™ may be licensed on your main Server or Server Farm – a simple and scalable solution that can meet the needs of small and large corporations.

Contact us for information.

0 comments on “Design for Resilience – A Different Look at Computer-Aided Engineering”