
Complexity is a fundamental physical characteristic of every system that may be found in Nature. Its importance is similar to that of energy. The first comprehensive measure of complexity for generic systems has been developed in 2003. The functionality of a given system is proportional to its complexity. More complex systems are able to perform more functions, a characteristic which is evident in our evolving biosphere. However, high complexity implies also an increase of management effort and energy. When taken to extremes, excessive complexity becomes a formidable source of exposure. This is because excessively complex systems are inherently fragile and capable of delivering surprising behaviour.
Structure is represented by means of graphs (maps) such as the one illustrated below. There exist numerous means of representing graphs or maps. A modern approach is illustrated below.
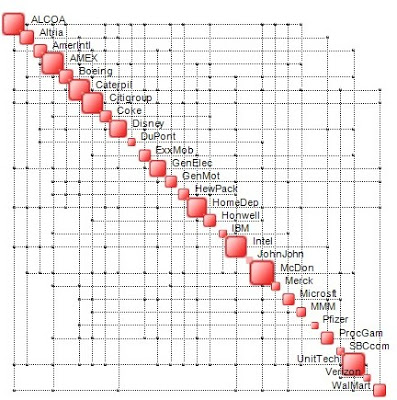
The intensities of the relationships between pairs of nodes are determined by computing the corresponding generalized correlations. Entropy and not standard deviation has been chosen as a measure of dispersion because it avoids the drawbacks of conventional techniques whereby one attempts to describe data via regression models, statistical analysis or other traditional methods. The huge advantage of our approach is that it is independent of numerical conditioning of the data and its ability to identify the existence of patterns where conventional methods fail.
Complexity, in a portfolio design and management contexts represents a new measure of volatility. Conventional measures of volatility, such as the beta, or covariances, are very simplistic. Complexity represents a comprehensive measure of volatility taking into account both the structure of a portfolio as well as its entropy content. Modern portfolio design and management techniques should take portfolio complexity into account. It is known that high complexity reflects situations in which surprising behavior is around the corner. This is true for any kind of system, including portfolios of assets.
We have tested the behavior of low-complexity and high-complexity portfolios built by selecting stocks from the Dow. The portfolios have been monitored in the period 25-th February – 30-th April, 2014. During this period, the Dow Jones Index has grown 1.85%. Two different strategies have been tested.
Strategy #1
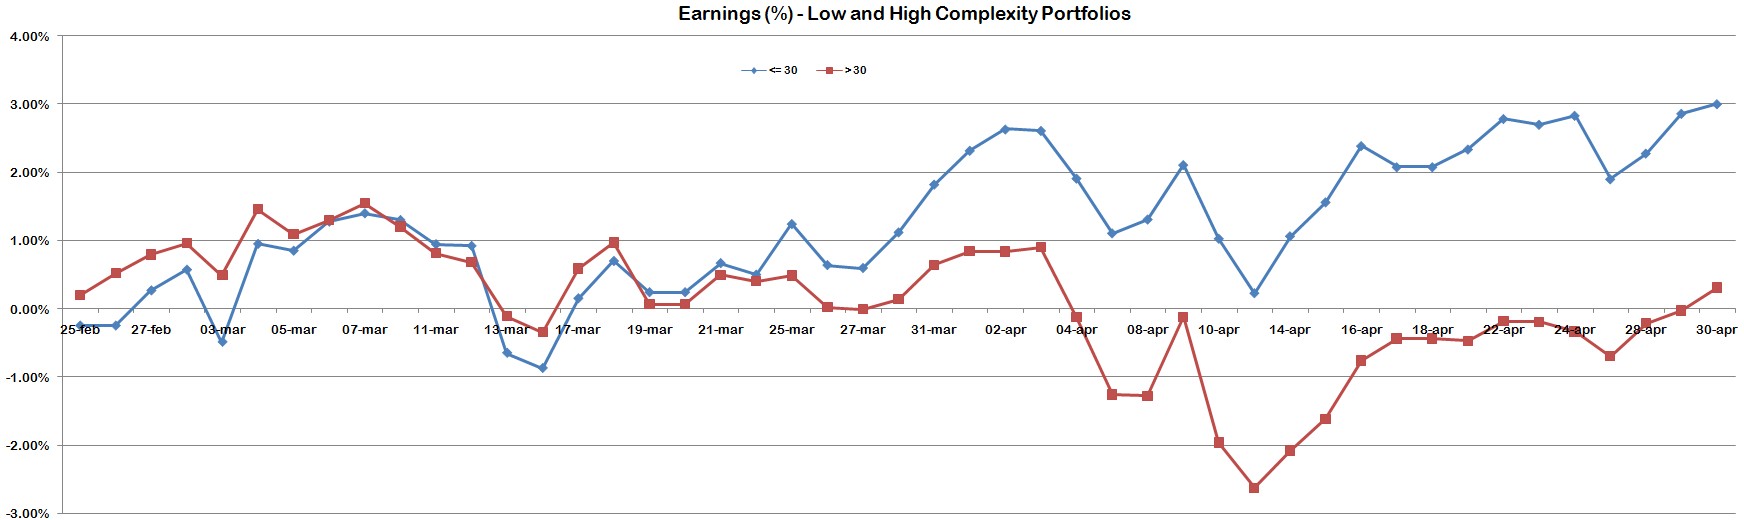
Strategy #2
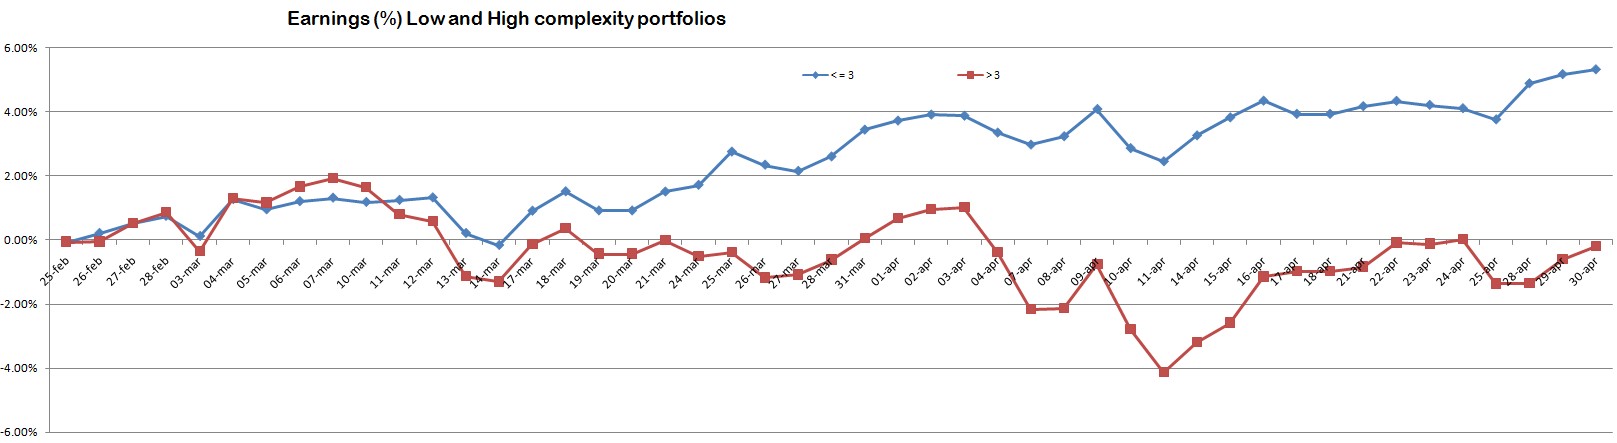
In both cases, low-complexity portfolios have performed significantly better than their high-complexity counterparts, offering a 3% and 5% performance over the 1.85% of the market.
If you are interested in measuring the complexity of a portfolio, contact Assetdyne. Assetdyne develops ASSETDYNEX™, an online tool for measuring and monitoring the complexity of portfolios as well as single stocks.

Reblogged this on Waltika and commented:
#interesting
LikeLike