
The World’s stock markets form a complex highly interdependent and dynamic network which embraces the entire global economy. This system of systems, comprising over 45000 interacting corporations, provides an instantaneous reflection of the world’s economy and its state of health. As of the end of November, the total value of equities in the 58 major stock markets reached $63.4 trillion. Clearly, the amount of information that this super system produces is overwhelming. In order to understand better its intricate dynamics, analysts have conceived indices, measures of volatility, ratios, etc. In every market combinations of the most important stocks are derived to produce indices of performance which are tracked by investors and analysts. Today, there exist thousands of such indices. Certain indices reflect the major companies traded in a particular market while others are constructed specifically to reflect a given sector of the industry.
An interesting question, at this point is how to combine, for example, the most important indices into a single ‘meta-index’, that would reflect the entire system of the World’s stock markets? The Global Financial Complexity Index (GFCI) introduced by Assetdyne is a meta-index, i.e. an ‘index of indices’, which measures of the complexity of this huge system based on the daily values of the indices composing it. The indices composing the GFCI meta-index are the following:
ATX, BFX, IETP, FCHI, GDAXI, OSEAX, FTSEMIB.MI, OMXSPI, SSMI, FTSE, STOXX50E, RTS.RS, OMXH25, TECDAX, DJI, NYA, IXIC, NDX, GSPC, SML, BATSK, RUA, RUI, SPSUPX, NIN, AORD, JKSE, KLSE, NZ50, N225, KS11, STI, HSI, TWII, PSEI.PS, MERV, BVSP, MXX, GSPTSE
The GFCI answers, for the first time, the question as to the complexity of the global financial system. We know that this system is highly complex. Today, we know just how complex that is. The GFCI is based on the closing values of the above indices and is therefore computed on a daily basis. Knowing the complexity of the global stock markets is useful for the following reasons:
- High complexity means the system is, globally speaking, highly volatile hence difficult to predict in terms of performance or dynamics
- Low complexity indicates a less turbulent situation
- Sudden changes in complexity reflect high instability
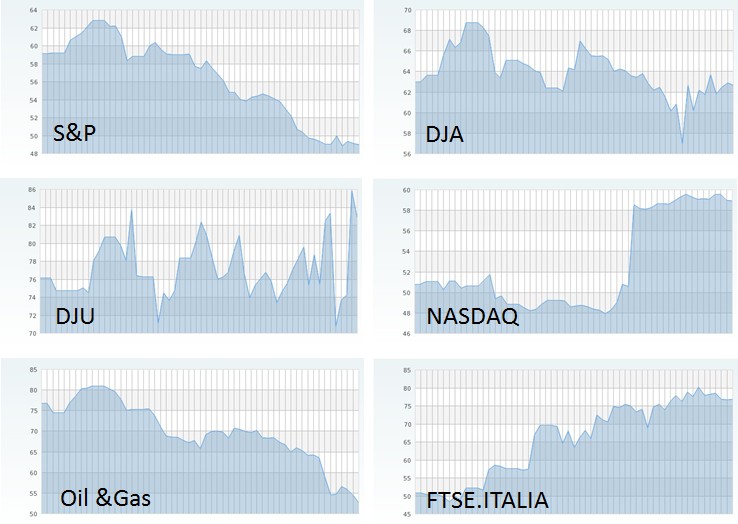
As we know, the complexity of any given system cannot evolve beyond a certain limit known as critical complexity. This too may be said of the global financial system. The Quantitative Complexity Theory states that in proximity of its critical complexity a given system becomes dominated by chaos and highly fragile. This means that it can suddenly behave in unexpected manner, transitioning spontaneously from one mode of behavior to another. The difference between a system’s current and critical complexity provides a measure of its resilience – its capacity to withstand shocks and extreme events. This Global Financial Resilience Index, GFRI, provides a measure of the overall ‘elasticity’ of the global financial system and its capacity to survive future crises. A value of the GFRI below 50% points to a system that is not well equipped to absorb contagion, the default of a systemic company or bank, shocks or destabilizing events, such as conflicts or severe climatic events. Evidently, both the GFCI and the GFRI may be useful for global and institutional investors also for large systemic banks and governments who manage very large portfolios of assets. As an example, the complexity and resilience index plots of a few major indices are indicated in the figures below. In each case, the graphs cover the last 60 trading days.
Complexity
 Resilience (0 – 100%)
These and the other major stock market indices are blended together to yield the GFCI and GRCI.
At the time of writing (28-th August, 2014) the indices have the following values:
GFCI = 37.7
GFRI = 57.8%
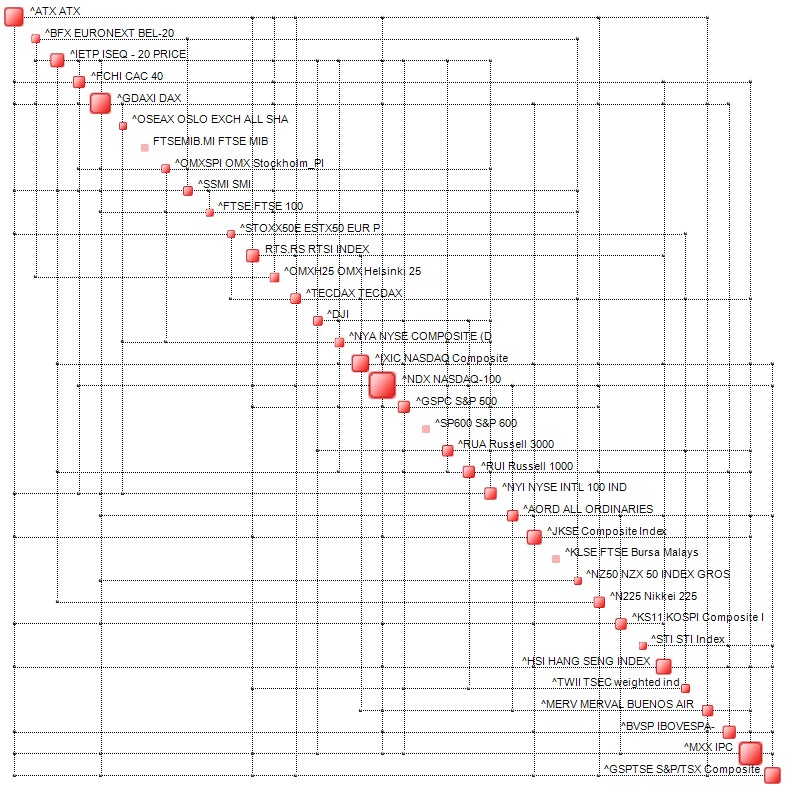
which yields a low two-stars rating (on a scale from 1 to 5 stars). This is a low value, which points to a limited capacity to absorb any major shocks or crises. The Complexity Map of the global financial system is illustrated in the figure below.
 An interactive map may be navigated here.
The value of the GFCI and GFRI indices are updated on a weekly basis and the corresponding values are displayed here.
In order to appreciate better the value of the indices it is important to analyze their evolution over a period of months. It will be interesting to verify how the indices react to events on a global scale, such as conflicts or catastrophes.
A natural development of the GFCI and GFRI is to compute them based on the actual closing values of each of the 45000 stocks and not based on a few tens of indices. Such a level of data granularity requires supercomputing resources but will certainly provide a more realistic picture.

0 comments on “The Global Financial Complexity Index – Measuring the World’s “Financial Temperature””