
 Recent research confirms that high portfolio complexity impacts negatively mid and long-term expected returns. This is because high complexity has been shown to be a formidable source of fragility, hence vulnerability. In a turbulent economy highly vulnerable portfolios and financial products are more exposed, therefore more risky. Assetdyne has demonstrated that a portfolio design strategy based on minimization of portfolio complexity produces portfolios that are able to provide significantly better returns.
The uniqueness of Assetdyne’s approach lies in the fact that it takes into account, for the first time, the fundamental characteristic of our global economy – its complexity. Conventional approaches adopt statistical techniques (such as regression) to compute the so-called beta coefficient, which is a measure of systemic risk of a portfolio or a security in comparison to the market as a whole. Complexity, on the other hand, provides information on how chaotic or predictable the evolution of a security or a portfolio is, as well as invaluable information on the structure of the interactions of portfolio components. Such information is crucial when it comes to designing and managing portfolios in highly turbulent regimes, dominated by shocks and extreme events.
The new complexity-based methodology for designing portfolios and asset allocation has been developed by Assetdyne in 2013 and is the basis of the new Complexity Portfolio Theory (CPT). The CPT goes beyond the old concepts of the Modern Portfolio Theory (MPT) and visions of an efficient and static market.
The present blog illustrates various examples of portfolios based on the DJI, NDX, OEX and STOXX50E indices.
The following assumptions have been made:
- Analysis period ranges from 2000-2013 to 2003-2013.
- Investment portfolios are re-designed every 100 days and contain a sub-set of the stocks composing each index.
- Investment portfolios are chosen based on Complexity Profiling of the entire indices. The procedure is proprietary.
- The stocks that are incorporated into an investment portfolio form the ‘LC portfolio’, while those that are discarded form the ‘HC portfolio’, where ‘LC’ and ‘HC’ stand for ‘Low Complexity and ‘High Complexity’ respectively.
- Complexity is computed based on the evolution of the daily closing values of stocks and takes into account all interactions between stocks.
- Costs of purchase and/or sale of stocks have not been accounted for.
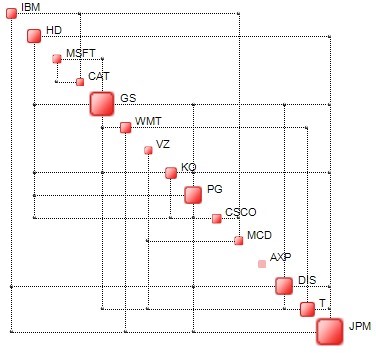
It has been found that with the above portfolio design strategy, the ‘LC portfolios (LC)’ generally perform better than portfolios based on the entire index, while the ‘HC portfolios (HC)’ offer generally inferior performance. Let us start with the DJI (Dow Jones Industrial) which is based on the following stocks:
AXP, BA, CAT, CSCO, CVX, DD, DIS, GE, GS, HD, IBM, INTC, JNJ, JPM, KO, MCD, MMM, MRK, MSFT, NKE, PFE, PG, T, TRV, UNH, UTX, V, VZ, WMT, XOM.
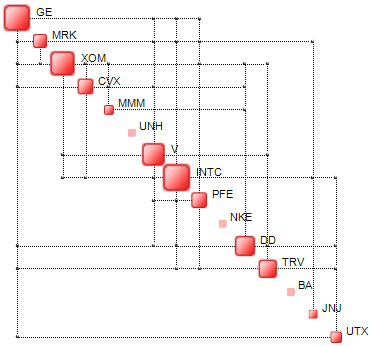
The objective is to build a portfolio of, say, 15 stocks, such that it possesses the lowest possible complexity. Examples of ‘LC’ (left) and ‘HC’ (right) portfolio Complexity Maps, obtained on 31/12/2013, are illustrated below. The maps reflect the structure of stock interdependencies.
 |
 |
In the case of the DJI, the long-term performance is the following:
 |
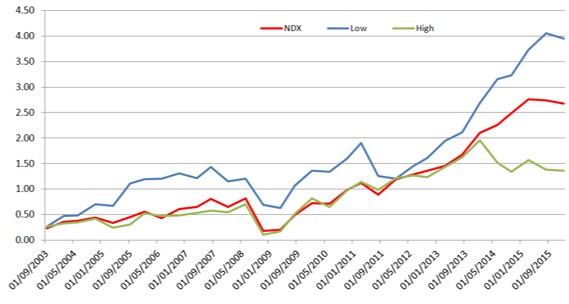
In the case of the NDX, the long-term performance is the following (multiply vertical scale by 100%).
 |
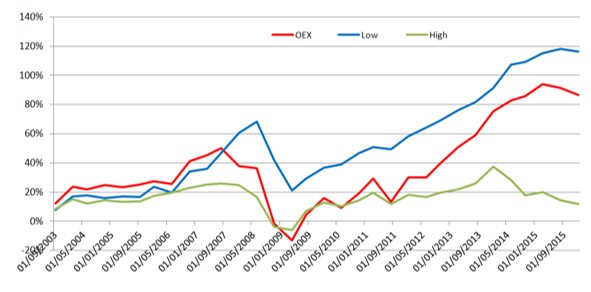
In the case of the S&P, the long-term performance is the following.
 |
In the case of the EUROSTOXX50, the long-term performance is the following.
 |
In conclusion, low-complexity portfolios offer performance which is generally superior to that of the corresponding indices. This is because low-complexity is an antidote to high turbulence and shocks, the key features of our troubled global economy. The results described herein demonstrate how new technologies can help establish innovative investment strategies in regimes of high instability and volatility.

0 comments on “Low Complexity Portfolios Beat Markets”