
 In a turbulent economy, punctuated by destabilizing events, resilience and complexity as the main new factors which are impacting the global economy and driving financial performance. Increasing volatility, complexity and uncertainty are becoming the hallmarks of our times. While the unprecedented challenges affecting the global economy are a source of both opportunities and threats, traditional analytics technology is insufficient when it comes to capturing new drivers of value creation.
In order to provide investors with new and meaningful tools, which take the uncertainty and turbulence of markets into account and which go beyond the conventional and anachronistic linear thinking models of the past, we have devised two new indicators, namely complexity and resilience.
Complexity, when applied to stock markets, measures their liveliness and degree of sophistication/interdependency. In essence, it is a new multi-dimensional equivalent of volatility. Obviously, it is more difficult to trade in a highly complex market than in one that is less complex. High complexity implies that the dynamics of a market are involved and difficult to grasp.
Resilience measures the capacity of a market to absorb destabilizing events without collapse. Resilience is the opposite of fragility and fragile systems can fail suddenly, without early-warning. This applies to single stocks, portfolios, markets, corporations or national economies. High resilience is a good-to-have property in today’s crippled economy.
Evidently, when we speak of complexity and resilience we are talking in terms of numbers, not sensations. Our work is quantitative. We believe that serious science starts when you begin to measure. The economy is too fragile to be analyzed and managed based on sensations or outdated analytical techniques. Tools must be appropriate for the task at hand and we must not be slaves of our own tools.
So, let us see how the complexity of the main US markets has been evolving in the past few years. The plots below illustrate the evolution of complexity and resilience of the Dow Jones, S&P and the NASDAQ markets. First complexity.
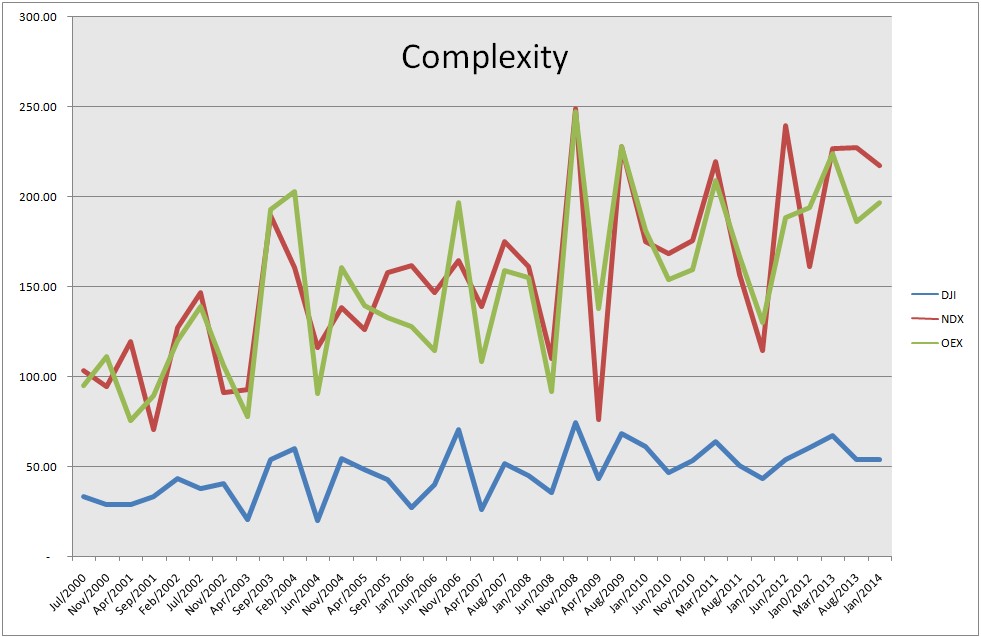
It is evident how the Dow is the least complex (volatile). In fact, while its complexity has grown by approximately 55% over the past 14 years, that of the S&P and NASDAQ has increased by more than 100% and 120% respectively. This makes of course sense as the DOW doesn’t contain volatile high-tech stocks. In any event, what the above plot shows is that the S&P and NASDAQ are approximately four times more dangerous for the non-expert (and probably for the expert too) than the Dow (the complexity ratio is approximately 200/50 = 4).
The evolution of resilience of these markets is depicted below. One may observe that, once again, the Dow is significantly more resilient than the S&P which, in turn, is clearly more resilient than the NASDAQ.
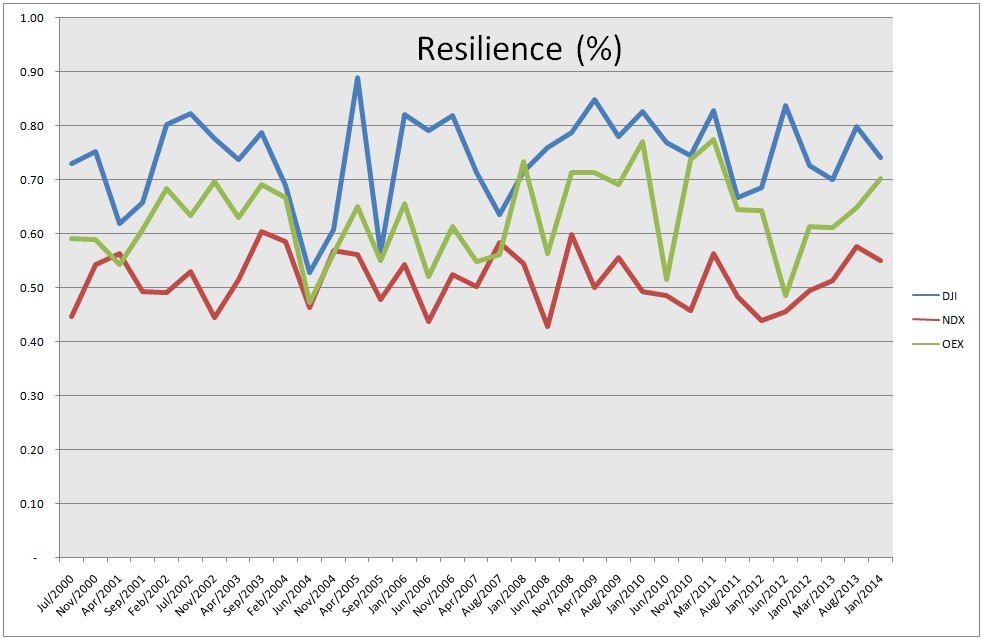
The average resilience of these markets over the past 14 years has remained essentially constant and is approximately the following:
Dow: 72%
S&P: 62%
NASDAQ: 51%
These numbers, together with the information on complexity, provide a great idea of how risky it is to trade on these markets. If you prefer a rough ride, go for the NASDAQ. If, on the other hand, your risk appetite is lower, you’re better off with the Dow. Finally, it is interesting to note how the complexity of the S&P and NASDAQ dropped sharply in reaction to the crisis in 2008. Since complexity measures liveliness, it is clear that both these markets still haven’t recovered the values of 2008.

0 comments on “Which US Markets are Most Complex (and Risky)?”