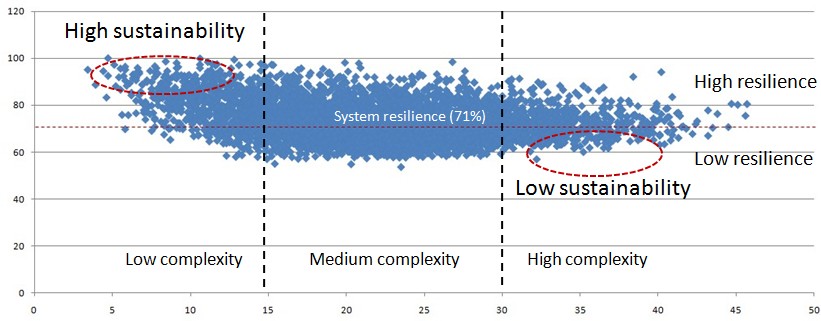
 Suppose that one wishes to invest in US public companies and eventually two candidate portfolios are available. Suppose that both portfolios are built on companies having a resilience that is higher than that of the entire system of US public companies. The plot below indicates the resilience and complexity of this system which comprises over 5000 companies. The horizontal dashed line indicates the resilience of the system, approximately 71% (this is not a statistical average!). Suppose the two portfolios contain companies which belong to the two pools indicated in the plot below.
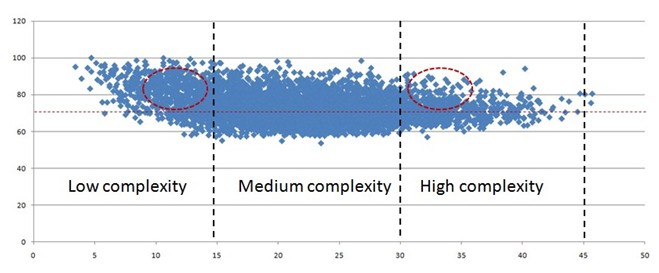 Figure 1 Low and high complexity portfolios with similar resilience.
The logic that ‘all things equal a simpler option is preferable’ applies. According to the Principle of Fragility, a less complex business is less fragile, hence potentially sustainable for longer periods. The ‘Too-Complex-To-Survive’ concept is one thing to always keep in mind. Excessively articulated and fragmented businesses tend to last less. The same logic applies to stock portfolios. Given the choice, one would select the pool on the left.
In a similar fashion, for a given business complexity a more resilient option is preferable. An example of two pools, from which to select candidates for an investment portfolio is indicated in the figure below. It is clear that in this case the pool of more resilient companies is preferred over the more fragile one.
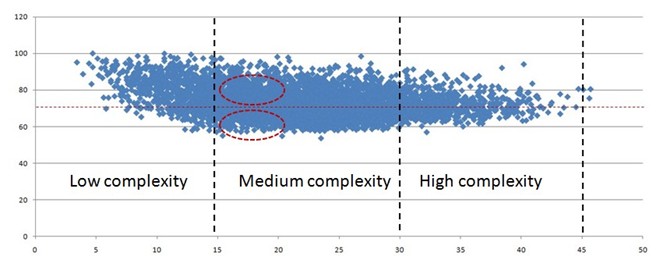 Figure 2 Low and high resilience portfolios with similar complexity.
Analysis of a number of sectors shows how, in effect, companies which have enjoyed a consistent increase of year-on-year assets are also those which have increased the resilience of their respective businesses. The analysis shows that this is clearly not always the case however, more companies which have increased their assets have also recorded an increase in resilience than those which didn’t.
Some examples are illustrated below.
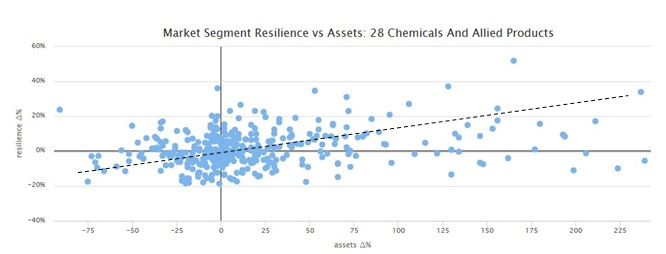
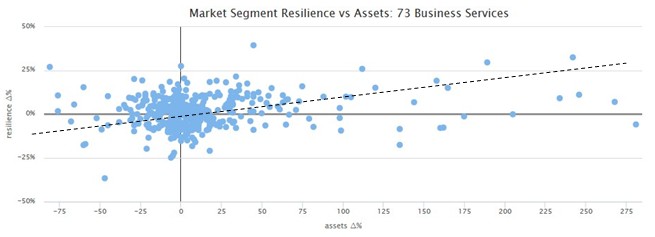

In conclusion, companies which have increased their resilience over time will probably also enjoy an increase of assets. These are good targets for investment as they are potentially more sustainable. Regions of low and high sustainability potential are indicated in the resilience-complexity map of the US market shown below.
 The systemic analyses was based on quarterly balance sheet information and involved hundreds of thousands of simultaneous variables, and millions of interactions (inter-dependencies) between these variables.
The collaboration of Metack in performing the above analyses is acknowledged. All analyses have been performed with the OntoNet™ engine.
By JM.

0 comments on “Investing Based on Systemic Analysis of Markets”