The Global Financial Complexity Index™ (GFCI™) is a meta-index which measures the complexity of the global financial system. The GFCI™ is based on the closing values of the indices of the World’s main market indices and is computed on a daily basis. Essential to the global investor, the GFCI™ measures the ‘temperature’ of the entire international financial system.
The index is based on the past six months of trading. Its values are absolute (>0). High values indicate intense interaction between the various market indices which are the following:
AORD, BSESN, HSI, JKSE, KLSE, KS11, N225, NSEI, NZ50, STI, TWII, 000001.SS, ATX, BFX, FCHI, FTSE, GDAXI, IBEX, SSMI, FTSEMIB.MI, IETP, STOXX50E, OMXH25, OMXSPI, OMXC20, DJA, DJI, DJT, DJU, GSPC, IXIC, MID, NDX, NYI, NYA, RUA, RUI, RUT, SML, BVSP, GSPTSE, MERV, MXX, TA100, BIST 100, IDX, TASI, TA-25, SET
The function of the GFCI is to combine the above 50 indices into one single meta-index. An example of Complexity Map of the GFCI is illustrated below.

The degree of market inter-dependency (i.e. density of the map) is 45%. The size of each node is proportional to its current contribution to the complexity of the entire system. As the dynamics of the various markets is complex and dominated by turbulence and volatility, the topology of the Complexity Map changes on a daily basis and reveals interesting information on the interplay of entropy and structure that compose the said complexity
However, one interesting feature of the GFCI is that it anticipates the drops of the indices which compose it. In the example below, it is shown how the GFCI precedes significant drops of the DJI falls. In most cases we’re talking of approximately 6 weeks, but cases with 3 and 8 weeks also appear.
In the plot below, both values of the Dow and the GFCI are reported in incremental terms (in %).
The red arrow indicates when the GFCI starts to drop, the blue one the corresponding fall of the DJI.
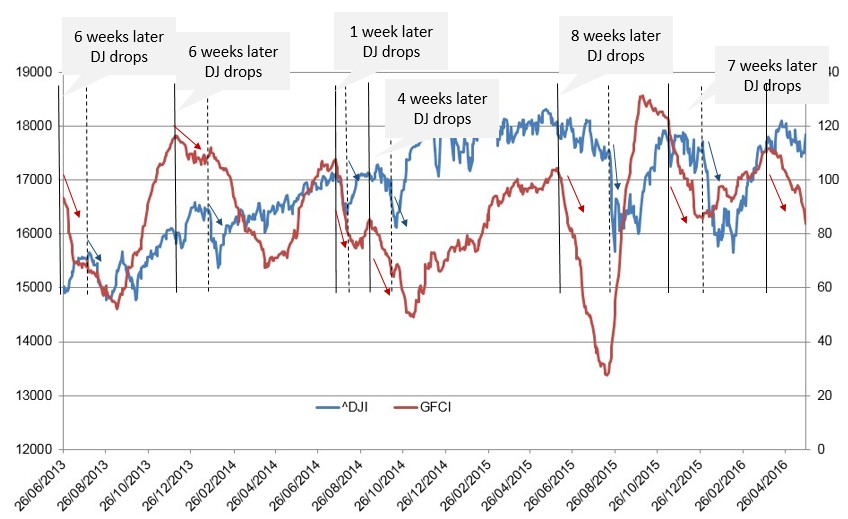
The degree of predictability is over 80%. The approach, which is illustrated for end-of -day values of the indices, may be extended to higher frequencies.
Analogous results are available for the NASDAQ, the S&P and other indices. The case of the NASDAQ is shown below (both curves start at 100%):

Want to know when the Dow or NASDAQ fall next time? Write to us at info@ontonix.com

0 comments on “Global Financial Complexity Index Anticipates Dow Jones Falls.”