

Businesses rely heavily on information and data. Many businesses actually store data. Some businesses use this data to derive statistics and models which are then used in an attempt to make the business more profitable, more efficient and streamlined. In other cases, models are used to produce forecasts, improve resource allocation, perform scenario analysis or even to make strategic decisions.
The kind of math models that are going to be discussed in this blog are plain vanilla algebra, not tensor calculus. This is high school stuff. Not rocket science. But let’s take a look at a very simple and hypothetical example. Warning – this is not a real case! Just an example.
Suppose the revenue (R) a business depends on advertising expenses (A). Suppose that the values of R and A are measured over a number of weeks. It is then child’s play to establish an equation relating R to A, as shown below (where y is R and x stands for A). The equation is obviously linear.
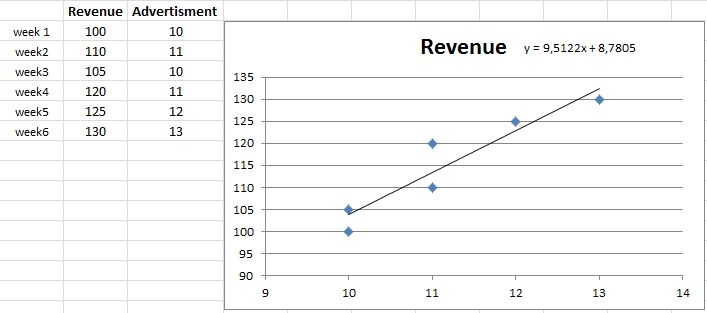
What can you do with this equation? This may sound shocking but the question is often asked and in those precise terms. Well, a few examples:
You can estimate the increase of revenue for a given increase in advertising. Or, you can solve the equation for A and figure ut how much advertising you’ll need if you want the revenue to have a particular target value.
If the dependency of revenue on advertising is non-linear, the situation could look like this:
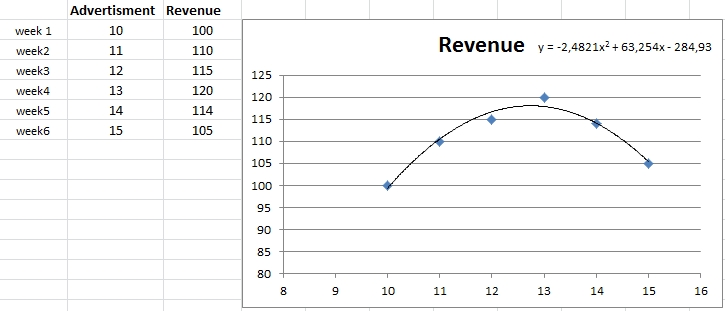
In a case like this you can do even more than in the linear case. You can now find the best value of A that maximizes R. This is called optimization and some people can get very sentimental about it.
The above two examples are trivial (and yes, unrealistic) in that they involve only one variable – advertising expenses (A). In a real case, there would clearly be many more variables to take into account, such as salaries, or costs of raw materials and components, taxes, etc., etc. In fact, the revenue of a business depends on very many variables and often not all of them are known.
Moreover, one would be interested not only in revenue but also in, say, profitability, or the company’s stock price if it is listed. So there would be more equations. For example, there could be an equation reflecting the relationship between stock price and advertising. And another one relating profitability and advertising….
Basically, in a realistic case we’re looking at a system of equations describing the performance of a business – these are called outputs – as function of the many variables that managers take into account when running the said business.
Let us see another hypothetical example, this time involving many variables, and representing, say, a retail bank. Banks, like other large businesses, depend on things like:
- Computers, data bases, networks, ICT in other words
- Human resources
- Distribution channels (branches)
- Operations
- General economic climate, exchange rates, commodity prices, unemployment
The list is clearly incomplete – Warning, this is just a hypothetical example! – the goal here is not to perform an in-depth analysis of a real case. Just illustrate some concepts
In the said example of a retail bank, let us relate the following outputs of interest:
- Revenue
- Profitability
- Stock price
- Operating costs
- EPS (Earnings Per Share)
to these inputs:
- ICT – total of 17 variables
- HR – 13 variables
- Branches – 9 variables
- Operations and operational risks – 13 variables
- Economy – 9 variables
Therefore, we’re looking at a system of 5 equations in 61 variables. Now, to build such equations we need data, just like in the trivial examples above. Such data obviously exists and is generally measured on a weekly, monthly or quarterly basis.
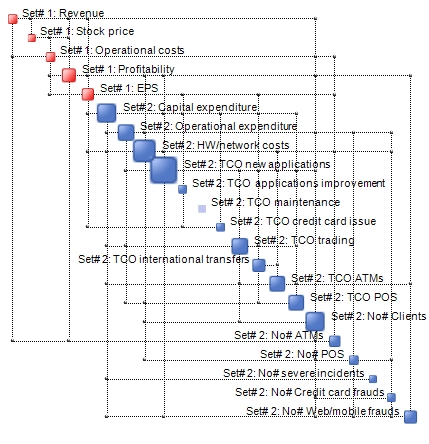
The following Complexity Maps illustrate the interdependencies between the five outputs – indicated in red – and all the variables of each of the five input groups. These can be obtained easily using OntoNet and a few Excel spreadsheets.
Outputs versus ICT
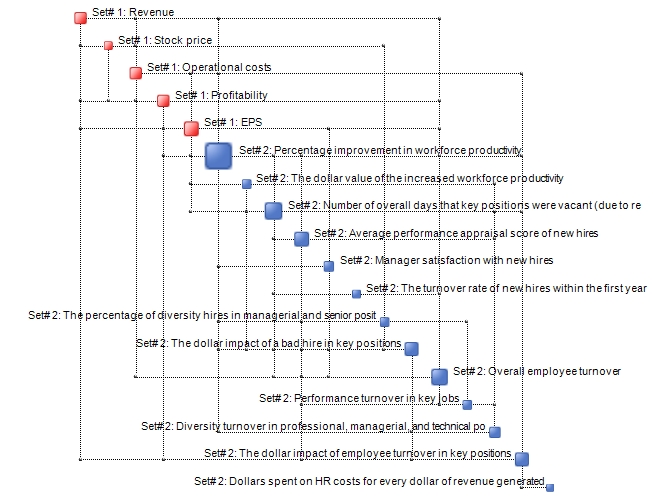
Outputs versus Human Resources
Outputs versus Branches
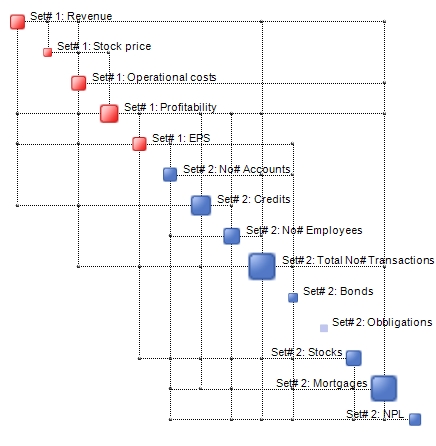
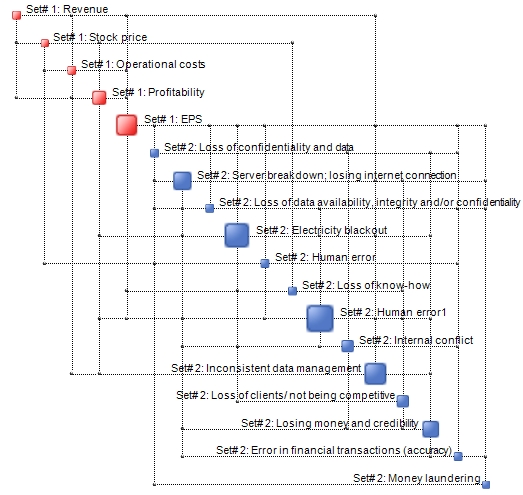
Outputs versus Operations and Operational Risks
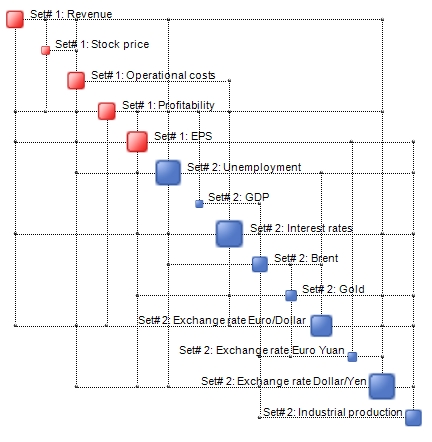
And finally, Outputs versus the economy (some macroeconomic indicators)
We don’t need to underline how important it is to actually know the structure of these maps. They basically reflect how things function. If the underlying data is correct and credible, these maps are real reflections of the way a business functions.
For example, suppose one wants to know in which measure the ICT-specific variables impact Earning Per Share (EPS). The following tornado plot – which has been computed based on our generalized correlations – provides the answer.
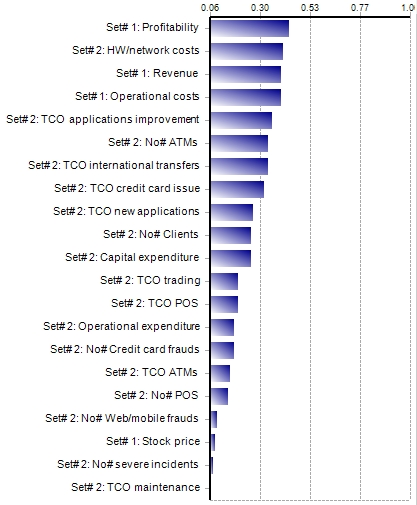
Similar charts can be produced for any output versus any input group. Now generalized correlations are bit like rocket science but just think of them like normal correlations except that they’re a bit better. In the case in question, there is, for example, a correlation of nearly 40% between the HW/network costs and EPS. In the case of EPS versus number of ATMs we’re down to around 33%. These are surely good things to know. But again, the example is hypothetical. We do not use real data from our clients and write about it in our blogs!
Back to the main issue. The said 61 variables spanning the 5 input groups are also related to each other. In other words, they are all interdependent to some degree. The Complexity Map below represents what we could call the Big Picture.
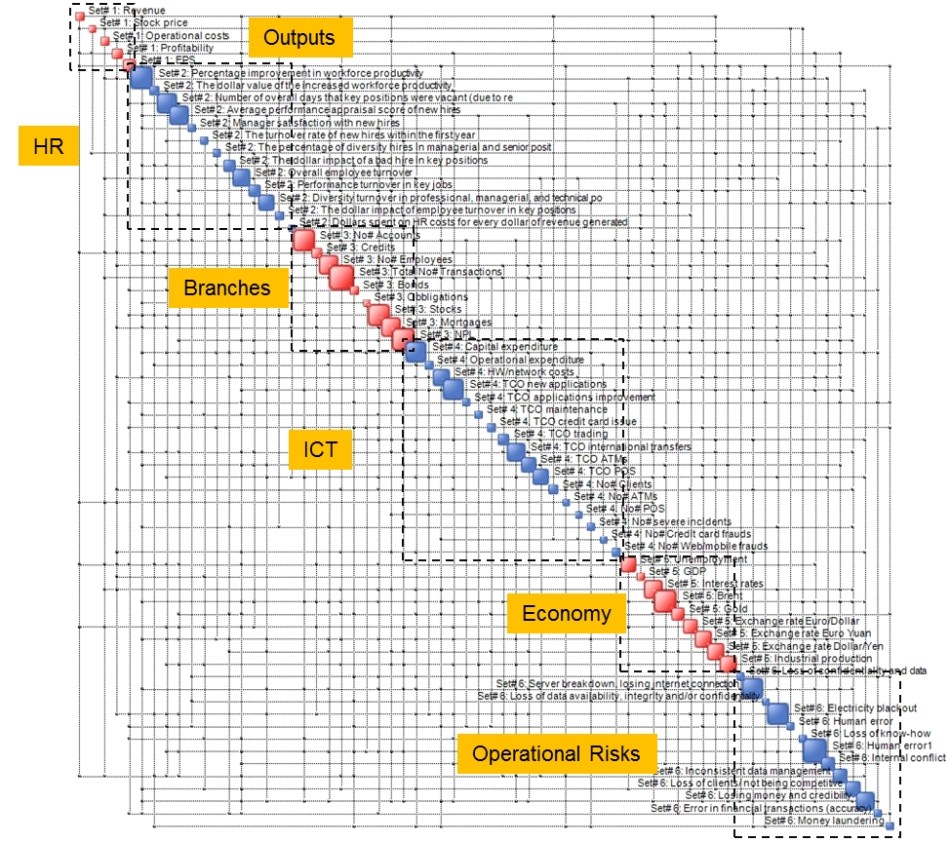
This is a holistic multi-disciplinary representation of a business, where one may appreciate its structure, the dominant variables (large nodes) and its intricacy. Even in such a small case we 842 interdependencies (correlations) between the variables. It is these interdependencies that can cause constraints and conflicts when it comes to resource allocation for making forecasts and performance goals.
The above map is instrumental towards determining the resilience and complexity of the business and the corresponding drivers. But that is another issue.
While such a map is in reality interactive and may be navigated and analyzed dynamically with our SW tools (such as OntoSpace) one can also cast the information it conveys in the form of equations. These formally look as follows:
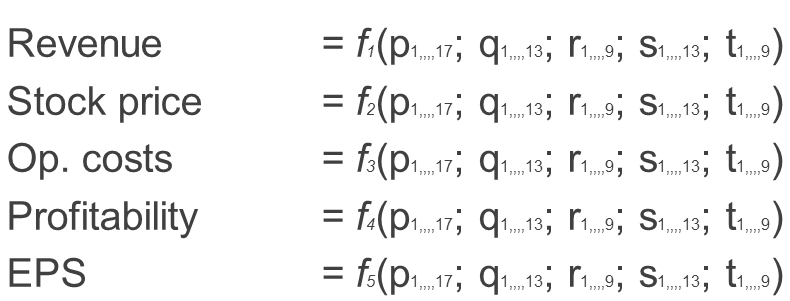
where variables p, q, r, etc. correspond to ICT, HR, Branches, etc.
We don’t show the actual equations here as they would occupy pages and pages but they can be easily held in the memory of a computer and manipulated using a variety of commercially available tools. Engineers call these equations Response Surfaces and use them on a daily basis.
N.B. The number of variables in these equations can be reduced by examining the tornado plots such as the one shown above, and removing variables which have a low (generalized) correlation with the outputs of interest.
Basically, these equations are an analytical representation of a Complexity Map. They can be manipulated so that one can find, for example, which values of inputs maximise Revenue, EPS and/or minimize at the same time Operational costs, etc., etc. The possibilities are endless.
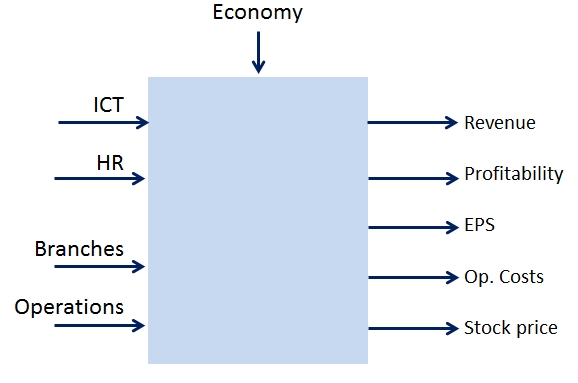
In essence, a business is a system with inputs and outputs. Just like any other system. What we have done here is to produce a set of equations that emulates its functioning. In this case, we have equations that describe the functioning of a retail bank.
An interesting application of these equations is in scenario analysis and scenario/strategy selection in combination with QCM (Quantitative Complexity Management). One can generate a set of feasible scenarios, measure the complexity of each and select the one with the lowest complexity. As usual, with all things being equal, the best solution is the simplest that works.

You actually make it seem really easy with your presentation but I to find this matter to be actually something that I feel I would by no means understand. It seems too complex and extremely huge for me. I’m having a look ahead for your subsequent put up, I’ll attempt to get the grasp of it!
LikeLiked by 1 person
You really make it seem so easy with your presentation however I to find this topic to be really something that I think I might by no means understand. It sort of feels too complex and very huge for me. I’m having a look ahead for your subsequent publish, I’ll attempt to get the grasp of it!
LikeLike