
Each year the World Bank publishes its Development Indicators data, which we analyze in order to measure and track the resilience and complexity of countries, macro regions and of the world as a system. The goal is to extract strategic and systemic information which may be useful to governments and government agencies especially in the context of management of disasters, crises, social unrest and conflicts as well as critical infrastructure protection.
The data spans economy, energy, transportation, information, education, health, infrastructures, telecommunication, debt, ecology, crime, ethnic and religious aspects, military, etc. A total of more than 1400 Development Indicators are provided per country and macro region. The picture, in other words, is broad-scope, broad-scale, offering a unique type of new information, knowledge and insight into the intricate dynamics of nations and of the world as a system.
The scope of this short blog is not to provide indepth analysis but merely to share some recent findings. To that end, we illustrate the evolution of complexity and resilience of a set of countries and marco regions, as well as of the world.
Complexity has the following meaning:
- from a mathematical point of view complexity quantifies the amount of structured information within a system
- from a physical perspective, complexity measures the intensity of Entropy > Structure and Structure > Entropy transformations within a system
From a more pragmatic perspective, complexity measures the degree of development, evolution, sophistication, potential and vitality. All systems try to evolve to higher levels of complexity because the functionality of a system is proportional to its complexity. More complex systems can perform more functions. Think of how biological organisms have evolved over time.

Think of how cell phones have evolved.

The process is natural and is driven by the laws of physics which Nature is not willing to negotiate.
Something similar happens to societies, cultures, economies, countries. Things naturally become more structured, more complex not less complex. Drastic reduction of complexity takes place in concomitance with disasters or conflicts. High complexity is not a bad thing, until it gets to close to the so called “critical complexity”, which corresponds to a state of chaos, unpredictability, little or no controllability, extreme fragility. Resilience is the opposite of fragility. A period of flat complexity corresponds to stagnation, lack of vitality. A loss of complexity reflects crisis, regression and destruction (not just of the economy but also of soeciety). Not progress.
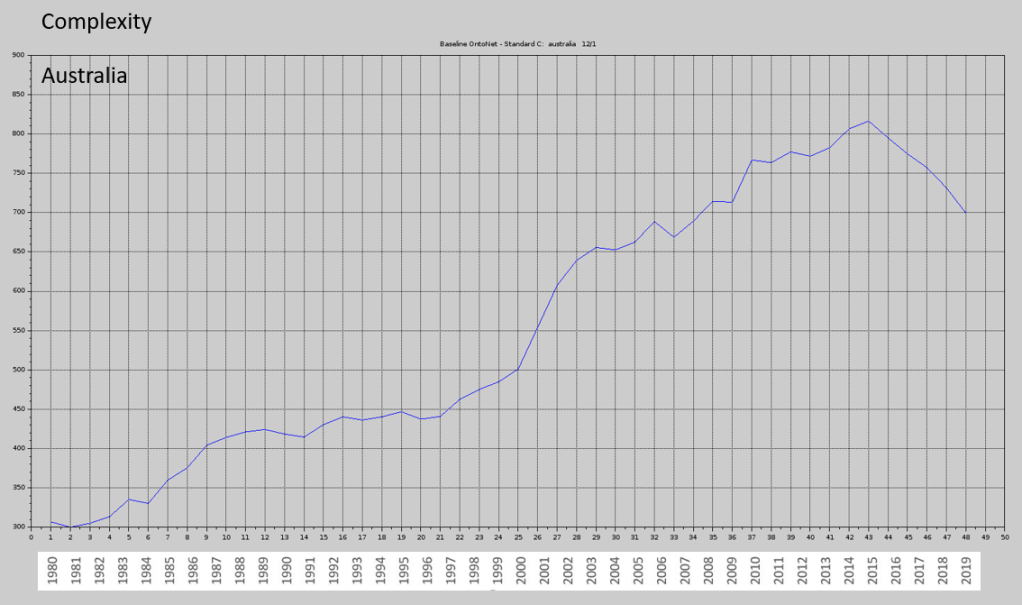
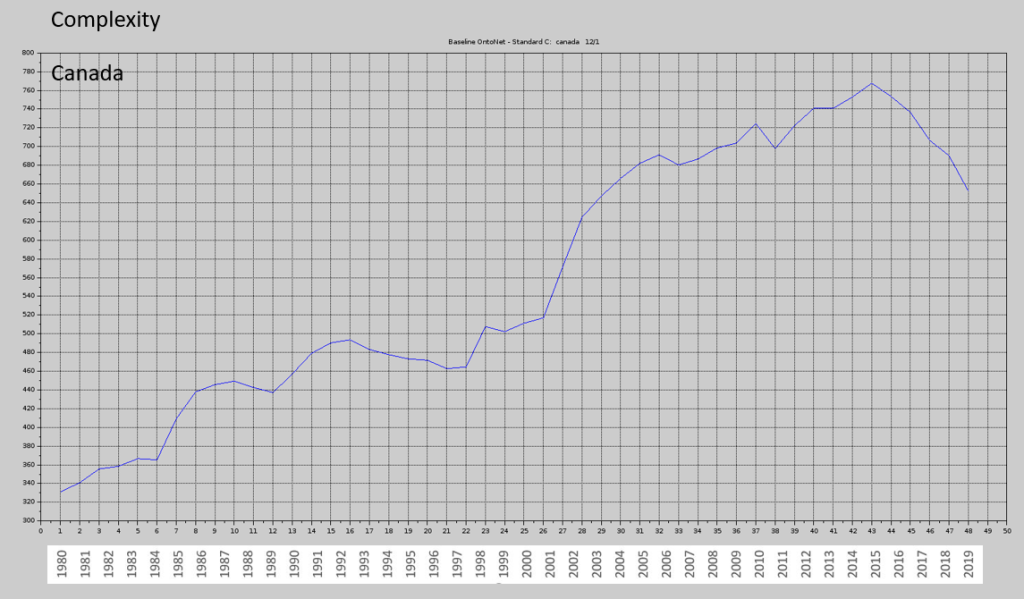
The following charts report complexity and resilience evolution in the period 1980-2019. We start with countries.
Australia
Brazil

Canada
China

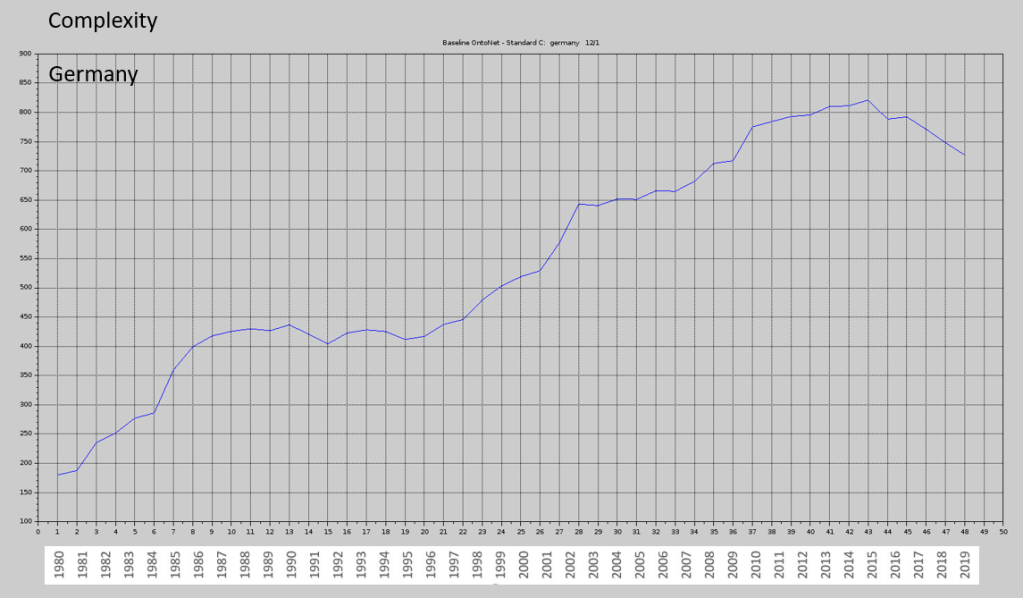
Germany
India

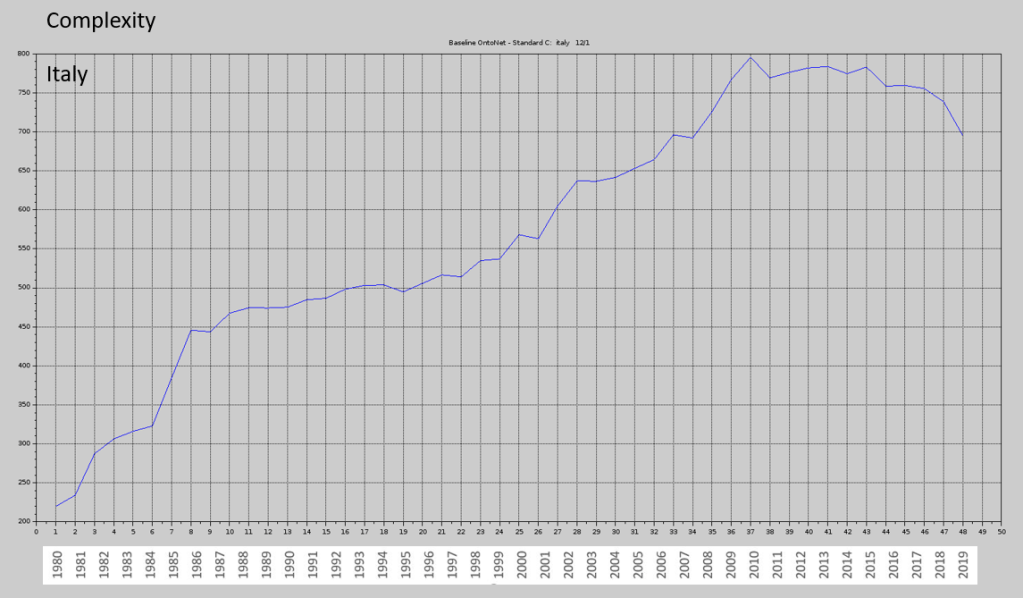
Italy
Poland

USA

Western nations in Europe all follow a similar pattern – after the reunification of Germany, complexity growth slows down significantly and remains low for 7-8 years. This the price Europe paid for the reunification. Other countries followed a similar trend, confirming that the world is globalized. However, countries like India and China have felt this effect to a much lesser extent. Emblematic, although entirely different, are the cases of Poland and China. Poland has been under Soviet rule until 1989. The result of decades of socialist devastation of the economy has been felt until the mid 1990s, when the country finally took off. The skyrocketing chart indicates how Poland’s complexity caught up with that of other developed nations in approximately 15 years.
The case of China is surprising, to say the least. The evolution of complexity of China is almost linear, quite smooth, seemingly independent of other countries, as if China were on another planet. What does this say of China? China, unlike many countries, appears to have a roadmap, which it follows consistently. China has leadership which focuses on growth rather than on destruction. It is not difficult to conclude what the future reserves.
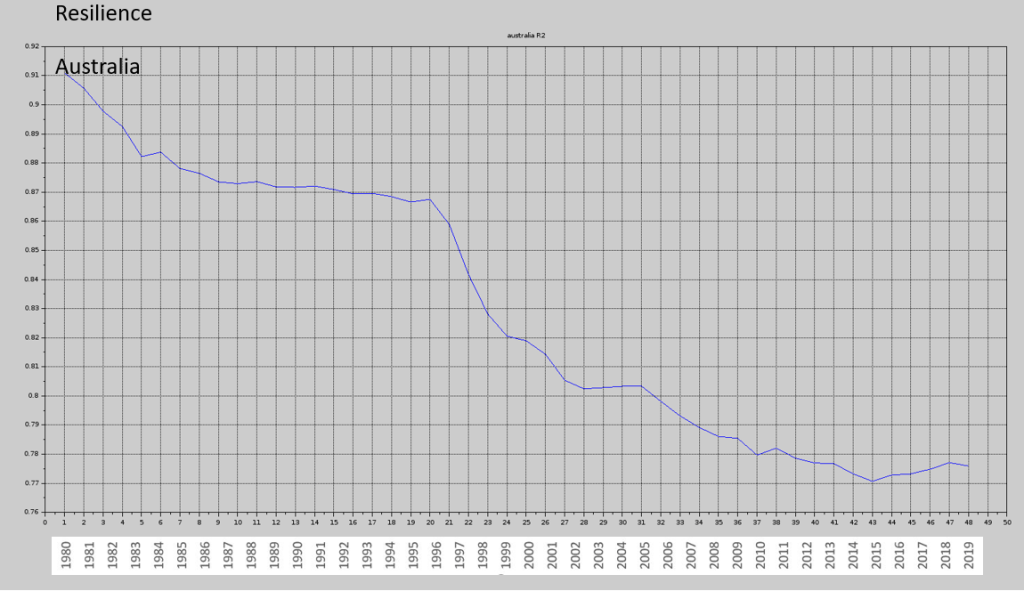
And now let’s look at resilience of the above countries. Since the world is tightly interconnected – think of the economy, finance, crime, information and information manipulation – the resilience of many countries has converged to very similar levels (75-80%) although following a different trajectory.
Australia
Brazil

Canada

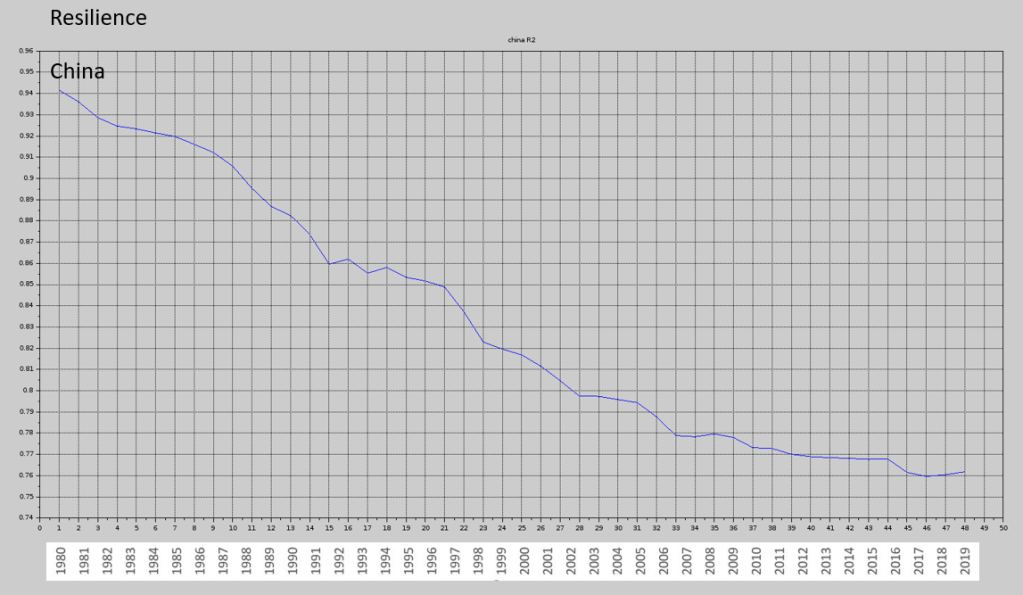
China
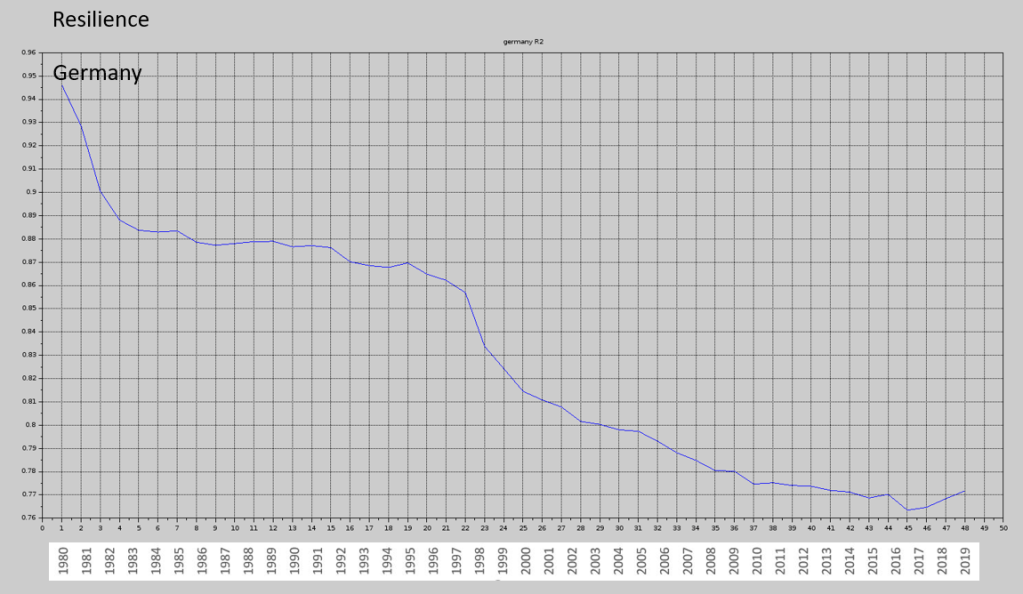
Germany
India

Italy

Poland

USA

In the second half of the 1990s, most countries experience a sharp loss of resilience which has slowed down only around 2010. Again, in the case of China, we observe a mild, more controlled and steady evolution of resilience. In the case of Poland, the drop in resilience is dramatic. The leftist totalitarian governments kept the country in a state of highly stable (resilient) stagnation and crisis, guaranteeing control over the society thanks to induced poverty, propaganda, fear and mis-information.
Let us now examine the complexity evolution of certain macro regions.
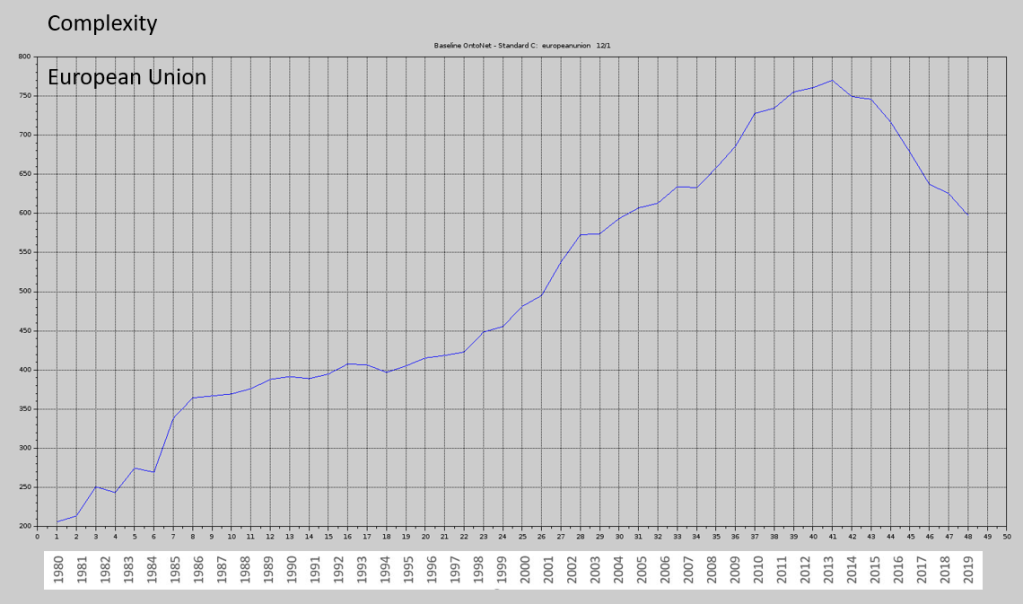
European Union
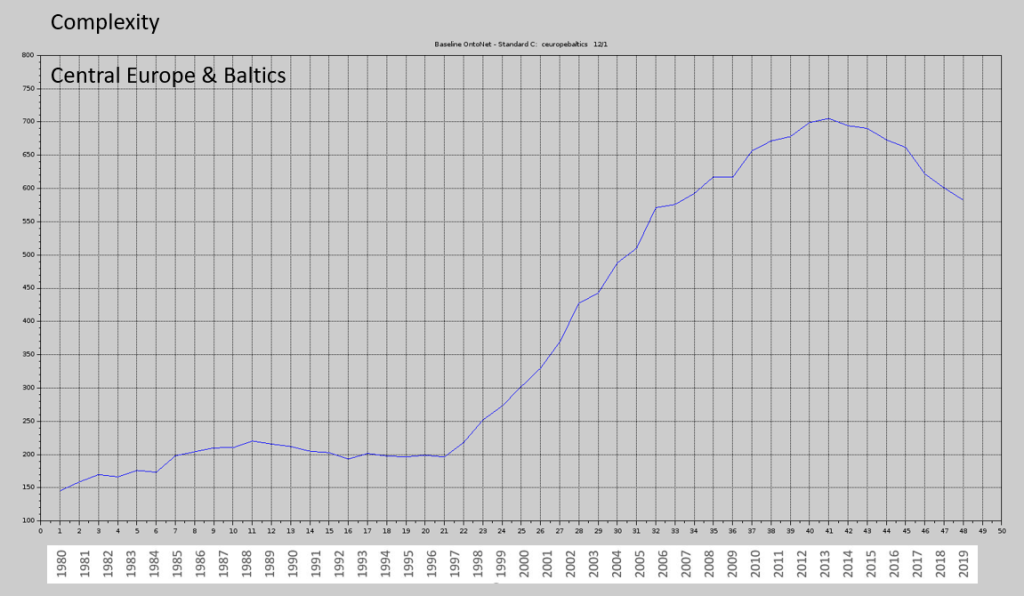
Central Europe & Baltics
World
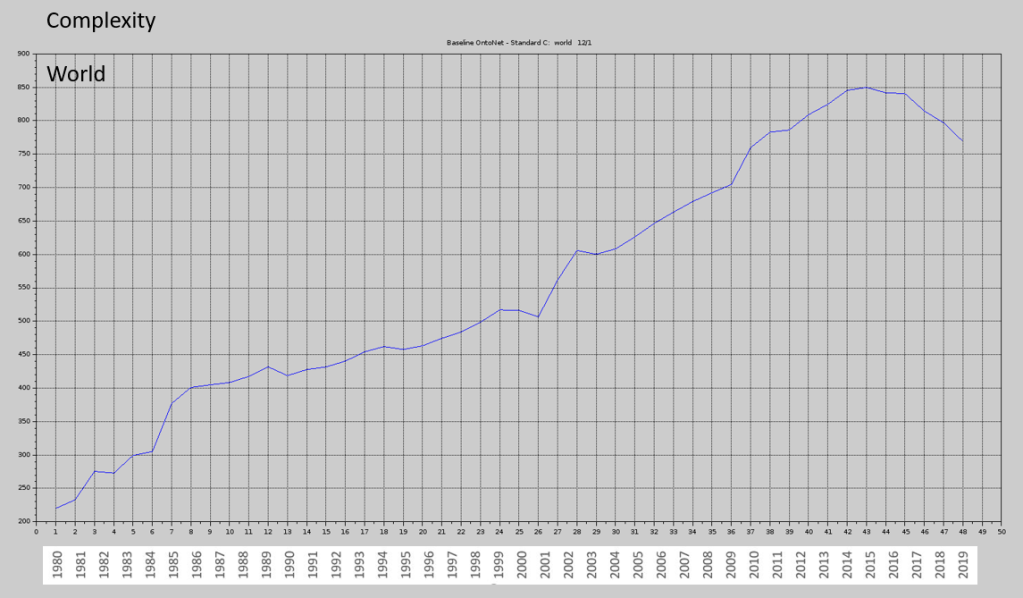
Central Europe and Baltics follow the pattern shown by Poland, the largest of the ex COMECON states. What is clearly visible is the dramatic loss of complexity of the European Union. Percentage-wise, this is the largest drop of complexity experienced by any macro region or even country. The complexity of the failed European project in 2019 is the same as in 2007 and, what is worse, the tendency is still in a stage of sharp reduction. If the tendency continues, in two years time the European Union will have regressed to levels of 2001-2002. This is equivalent to a loss of 20 years.
And now a look at resilience.
European Union

Central Europe & Baltics

World
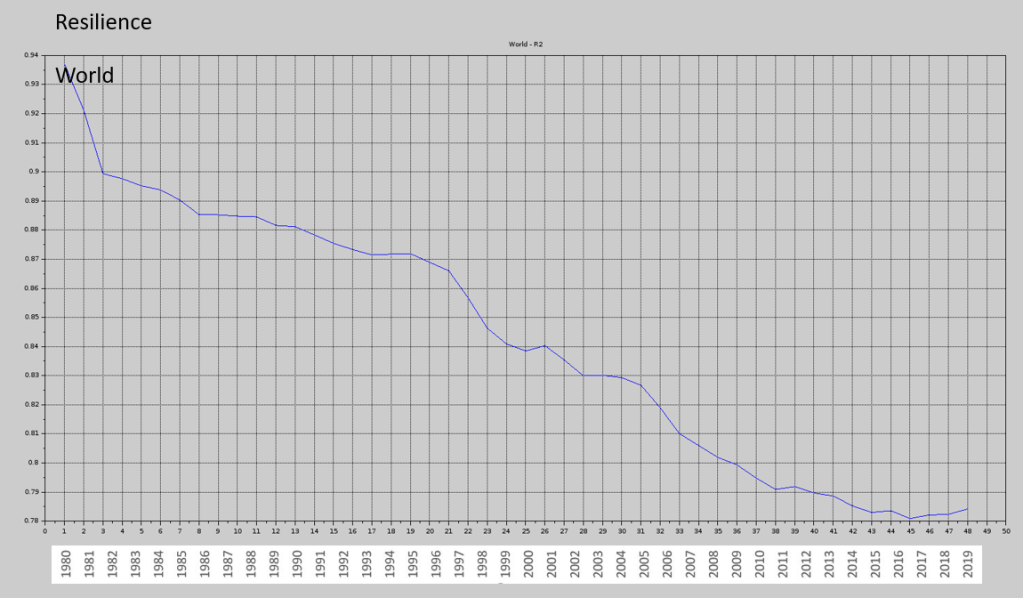
In terms of resilience, the World is slightly less resilient than the macro regions as well as most countries. The European Union is resilient – around 80% – and, like in the case of the other macro regions, the tendency is to increase. Is this good? Well, resilient systems by definition tend to oppose change. And nowhere more than in the EU it is vital to implement change and reforms. It is paramount to avoid converging into a situation of low complexity and high resilience which is equivalent to the COMECON, which was founded by J. Stalin in 1949. Look at Poland, Central Europe and the Baltics.
The information displayed in this short blog is only a fraction of what a Comlexity and Resilience analysis of massive amounts of data can reveal. We are able, for example, to indicate which of the 1400+ factors are responsible for the various phenomena described herein, or which are the main risk sources for each country or region. This information is, however, not freely available.
Contact us for information at info@ontonix.com

0 comments on “Complexity and Resilience Analysis of World Bank’s 2019 Development Indicators”