

Jacek Marczyk Ph.D., Balachandra Deshpande Ph.D. (2007)
1. Introduction
The study of complex systems such as the biosphere, gene expression data or the climate, has led to an increased understanding of their behaviour and characteristics and only now are we appreciating their overwhelming complexity. One common denominator of all these systems is, obviously, complexity. However, even though complexity is becoming an increasingly important issue in modern science and technology, there are no established and practical means of measuring it. Clearly, measurement constitutes the basis of any rigorous scientific activity. The ability to quantify something is a sine-qua-non condition towards being able to manage it.
There do exist numerous complexity measures, such as, the (deterministic) Kolmogorov-Chaitin complexity, which is the smallest length in bits of a computer program that runs on a Universal Turing Machine and produces a certain object x. There are also other measures such as Computational Complexity, Stochastic Complexity, Entropy Rate, Mutual Information, Cyclomatic Complexity, Logical Depth, Thermodynamic Depth, etc. Some of the above definitions are not easily computable. Some are specific to either computer programs, strings of bits, or mechanical or thermodynamic systems. In general, the above definitions cannot be used to treat generic multi-dimensional systems from the standpoint of structure, entropy and coarse-graining.
At Ontonix we have developed a comprehensive complexity metric and established a conceptual platform for practical and effective complexity management. The metrics established take into account all the ingredients necessary for a sound and comprehensive complexity measure, namely structure, entropy and data granularity, or coarse-graining. The metric allows one to relate complexity to fragility and can show how critical threshold complexity levels may be established for a given system. The methodology is incorporated into OntoSpaceTM, a first of its kind complexity management software developed by Ontonix.
There doesn’t exist a widely accepted definition of complexity. Many of the popular definitions refer to complexity as a ”twilight zone between chaos and order”. It is often sustained that in this twilight zone Nature is most prolific and that only this region can produce and sustain life. Clearly, such definitions do not lend themselves to any practical use since they don’t provide any measure or quantity. We define complexity as amount of functionality, capacity, potential or fitness. The evolution of living organisms, societies or economies constantly tends to states of higher complexity precisely because an increase in functionality (fitness) allows these systems to “achieve more”, to face better the uncertainties of the respective environments, to be more robust and fit, in other words, to survive better.
Complexity is not a phenomenon, it is not emergence, as it is often stated in popular-science books. It is a quantity which can be measured, such as mass, energy or frequency. In order to increase our understanding of complexity and of the behaviour of complex systems, and in order to favor the development of the science of complexity, it is paramount to establish rigorous definitions and metrics of complexity. The common misconception about complexity is that it is often equated to emergence. Emergence of new structures and forms is the result of re-combination and spontaneous self-organization of simpler systems to form higher order hierarchies. Amino acids combine to form proteins, companies join to develop markets, people form societies, etc. This is not complexity.
Recent years have seen the emergence of a new approaches to the study of diverse problems in natural, social and technological fields: the science of complexity [Gell-Man 1994]. The objective of complex systems science is to comprehend how groups of agents, e.g. people, cells, animals, organizations, the economy, function collectively. The underlying concept of complexity science is that any system is an ensemble of agents which interact. As a result, the system exhibits characteristics different from that of each agent, leading to collective behaviour [Gell-Man 1994]. This property is known as emergence [Morowitz 2002]. Moreover, complex systems can adapt to changing environments, and are able to spontaneously self-organize [Sornette 2000]. The dynamics of complex system tends to converge to time patterns, that are known as attractors [Sornette 2000] and is strongly influenced by the agent inter-relationships, which can be represented as networks [Barabasi 2002]. The topological properties of such networks are crucial for determining the collective behaviour of the systems, with particular reference to their robustness to external perturbations or to agent failure [Barabasi, Albert 2000], [Dorogovtsev 2003]. Although the theoretical exploration of highly complex systems is usually very difficult, the creation of plausible computer models has been made possible in the past 10-15 years. These models yield new insights into how these systems function. Traditionally, such models were studied within the areas of cellular automata [Chopard 1998], chaos theory [Sornette 2000], control theory [Aguirre 2000], evolutionary programming [Zhou 2003], non-linear dynamics [Sornette 2000] and neural networks [Haykin 1999]. The practical applications these studies cover a wide spectrum, ranging from studies of DNA and proteins [Jeong 2001] to computational biology [Dezso 2002], from economics and finance [Mantegna 2000] to ecology [Lynam 1999] and many others. When addressing complexity and complex systems, many researchers illustrate the ways in which complexity manifests itself and suggest mathematical methods for the classification of complex behavior. Subjects such as cellular automata, stochastic processes, statistical mechanics and thermodynamics, dynamical systems, ergodic and probability theory, chaos, fractals, information theory and algorithmic complexity and theoretical biology, etc. are consistently covered but without very few concrete attempts to actually practically quantify complexity and to track its evolution over time.
2. Fitness Lanscapes and Attractors
The concept of Fitness Landscape is central towards the determination of complexity of a given system. We define a fitness landscape as a multi-dimensional data set, in which the number of dimensions is determined by the number of systems variables or agents (these may be divided into inputs and outputs, but this is not necessary).

Figure 1. Example of Fitness Landscape. The four views refer to the same data-set and represent different combinations of axes. As one moves within the landscape, different local properties, such as density for example, will be observed in the vicinity of each point. The fitness in in every point of the landscape is equated to complexity.
The number of data points in the landscape is equal to the number of measurements or samples that make up the data set. Once the fitness landscape is established (either via measurement or Monte Carlo Simulation), we proceed to identify regions in which the system locally possesses certain properties which may be represented via maps or graph, which we call modes. It is not uncommon to find tens or even hundreds of modes in landscapes of low dimension (say a few tens). Once all the modes have been obtained we proceed to compute the complexity of each mode as function of the topology of the corresponding graph, the entropy of each link in the graph and the data granularity. We define data granularity in fuzzy terms and, evidently, this impacts the computation of entropy for each mode. We define fitness at a given point of the landscape to be equal to complexity of the mode in that point. Since the same modal topology may be found in many points of the landscape, there clearly can exist regions of equal fitness. We may also define the total fitness landscape complexity as the sum of all the modal complexities.

Figure 2. Examples of modes. The variables (agents) are arranged along the diagonal and significant relationships are determined based on a proprietary algorithm. Red nodes represent hubs. The mode on the left has complexity of 91.4, while the one on the right a value of 32.1. Both modes originate from the same landscape.
Examples of modes are indicated in Figure 2, where one may also identify hubs – indicated in red – the number of which may be related to numerous properties such as robustness, fragility, redundancy, etc. As one moves across the landscape, the modal topology will changes, and so will the hubs.

Figure 3. Examples modal complexity spectrum.
The complexities of all the extracted modes in a given landscape may be plotted in ascending order, forming the complexity spectrum. Flat spectra point to homogeneous landscapes while in the contrary case they clearly point to rugged and/or cluster-dominated scenarios.
There is a sufficient body of knowledge to sustain the belief that whenever dynamical systems, such as those listed above, undergo a crisis or a spasm, the event is accompanied by a sudden jump in complexity. This is also intuitive. A spasm or collapse implies loss of functionality, or organization. The big question, then is: to what maximum levels of complexity can the above systems evolve in a sustainable fashion? In order to answer this question, it is necessary to observe the evolution of complexity in the vicinity of points of crisis or collapse. We have studied empirically the evolution of complexity of numerous systems and have observed that:
High-dimension systems can reach higher levels of complexity (fitness).
The higher the graph density the higher the complexity that can be reached.
The higher the graph density the less traumatic is breakdown of structure.
For dense systems, the “life-death” curve looks like y(t)= t*A*exp(-k*t^4).
The plots in Figure 3 illustrate examples of closed systems (i.e. systems in which the Second Law of Thermodynamics holds) in which we measured how complexity changes versus time. We can initially observe how the increase of entropy actually increases complexity – entropy is not necessarily adverse as it can help to increase fitness – but at a certain point, complexity reaches a peak beyond which even small increase of entropy inexorably cause the breakdown of structure. The fact that initially entropy actually helps increase complexity (fitness) confirms that uncertainty is necessary to create novelty. Without uncertainty there is no evolution.
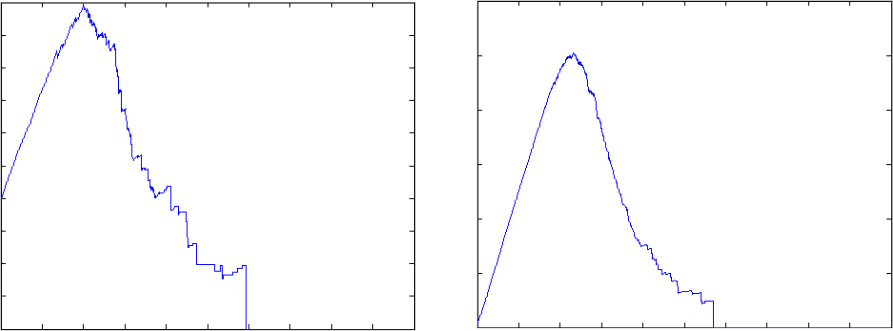
Figure 4. Examples of evolution of complexity versus time of two closed systems. The plot on the left represents a 20-dimensional system, while the one on the right a 50 dimensional one. In the case of the smaller system, the maximum value of complexity that may be reached is approximately 3, while in the case of the larger system the threshold is approximately 12. The corresponding graphs have density of 0.1 and 0.2, respectively.
In our metric, before the critical complexity threshold is reached, an increase in entropy does generally lead to an increase in complexity, although minor local fluctuations of complexity have been observed in numerous experiments. After structure breakdown commences, an increase in entropy nearly always leads to loss of complexity (fitness) but at times, the system may recover structure locally. However, beyond the critical point, death is inevitable, regardless of the dimensionality or density of the system.
3. Conclusions
We propose a comprehensive complexity metric which contemplates structure, entropy and data coarse-graining. Structure, represented by graphs, is determined locally in a given fitness landscape via a proprietary technique. Entropy of each mode (graph) is computed based on the data granularity. Finally, fitness in each point of the landscape is defined as complexity. The metric has been applied to a wide variety of problems, ranging from accident analysis of nuclear power plants, to gene expression data, from financial problems to analysis of socio-economical sytems. The metric shows how a closed system will reach a certain maximum complexity threshold, after which even a small increase in entropy will commence to destroy structure.
References
Gell-Mann. The quark and the jaguar : adventures in the simple and the complex. New York: W.H. Freeman and Co.; 1994.
H.J. Morowitz. The emergence of everything: how the world became complex. New York: Oxford University Press; 2002.
D. Sornette. Critical phenomena in natural sciences : chaos, fractals, selforganization, and disorder : concepts and tools. Berlin ; New York: Springer; 2000.
A.-L. Barabasi. Linked: the new science of networks. Cambridge, Mass.: Perseus Pub.; 2002.
A.-L. Barabasi, R. Albert. Statistical mechanics of complex networks. Reviews of Modern Physics. 2002 2002; 74(1) : 47-97.
S.N. Dorogovtsev, J.F.F. Mendes. Evolution of networks: from biological nets to the Internet and WWW. Oxford ; New York: Oxford University Press; 2003.
B. Chopard, M. Droz. Cellular automata modeling of physical systems. Cambridge, U.K. ; New York: Cambridge University Press; 1998.
CHA. Aguirre, L. A. B. Torres. Control of nonlinear dynamics: where do the models fit in? International Journal of Bifurcation and Chaos. 2000;10(3):667-681.
C. Zhou, W. Xiao, T.M. Tirpak, P.C. Nelson. Evolving accurate and compact classification rules with gene expression programming. IEEE Transactions on Evolutionary Computation.2003; 7(6): 519-531.
Haykin. Neural networks: a comprehensive foundation. 2nd ed. Upper Saddle River, N.J.: Prentice Hall; 1999.
H. Jeong, S.P. Mason, A.L. Barabasi, Z.N. Oltvai. Lethality and centrality in protein networks. Nature. May 3 2001; 411(6833): 41-42.
Z. Dezso, A.L. Barabasi. Halting viruses in scale-free networks. Phys Rev E Stat Nonlin Soft Matter Phys. May 2002; 65 (5 Pt 2): 055103.
R.N. Mantegna, H.E. Stanley. An introduction to econophysics: correlations and complexity in finance. Cambridge, UK ; New York: Cambridge University Press; 2000.
T. Lynam. Adaptive analysis of locally complex systems in a globally complex world. Conservation Ecology. 1999;3(2):13.

0 comments on “Measuring and Tracking Complexity”