

From “Governing a Liquid Society”, by J. Marczyk, 2019.
It is said that the World is complex and that it is becoming more complex every year. This statement appears to be true, but just how complex is that? Complexity is certainly the hallmark of our time. Systems which grow or evolve tend spontaneously to states of higher complexity because of the laws of physics not just because of intuition. Higher complexity implies more potential, more activity and more functionality. But it also implies more effort in terms of management and, last but not least, difficulty in comprehending the very nature of the system in question. In biology we could say that complexity reflects ‘vitality’, in economics ‘potential’. It may be said, therefore, that the ‘amount of evolution’ and growth of a given system can be measured by its complexity.
Analysing data from the World Bank covering the period 1971-2017, the evolution of the complexity of the World has been measured. There are currently 195 countries each of which is monitored by the World Bank via a series of over 1200 development indicators, covering the economy, energy, transportation, education, healthcare, infrastructures, agriculture, environment, telecommunications, finance, crime, military expenses, etc. Doing the arithmetic this leads to approximately 250000 parameters which describe the entire system. The data is collected on annual basis. The result is shown in Figure 1.

Figure 1. Global complexity in the period 1971-2017
It is interesting to note how the World has been becoming more complex at an essentially steady rate. Fluctuations correspond to destabilizing events (geopolitical events, energy crises, major market crashes, conflicts, etc.). Drops of complexity corresponds to a slowing down of the system at global level. What is extremely interesting is to consider the evolution of entropy in the same period, see Figure 2. Entropy measures the amount of chaos or disorder. It can also be seen as a measure of ‘waste’ in a broad sense. In fact, every evolutionary step requires energy and produces waste. This is inevitable. Again, the Second Law of Thermodynamics is the reason why. The Entropy Footprint of a corporation (or a country) which can be computed today, is more significant than the anachronistic CO2 footprint precisely because it takes into account waste from a broader, systemic and holistic perspective.
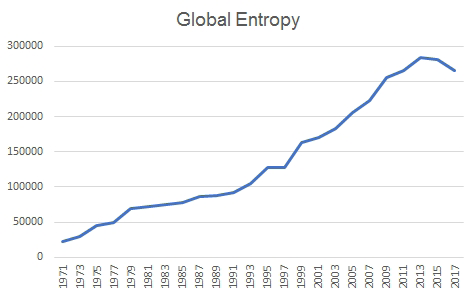
Figure 2. Global entropy (disorder) in the period 1971-2017.
After approximately 1995 the rate of entropy growth – waste generation – has increased dramatically. In fact, it doubles. The bottom line is that after approximately 1995 the world has doubled the amount of waste it needs to produce in order to move forward. This is very alarming.
A third key characteristic of every system is it’s resilience. While complexity quantifies the ‘amount of structure’ a system has developed, and entropy the waste this development entails, resilience reflects a system’s ability to resist shocks. The evolution of global resilience is depicted in Figure 3. Again, an almost linear downward trend may be observed. In 45 years resilience has dropped by 14%, from 94% to 80%. Experience suggests that system with a resilience of 50% or less are not only quite fragile but also difficult to govern as their structure is very feeble and unstable. Simple linear extrapolation indicates that, if the trend continues, the World will reach a resilience of 50% in approximately 2100-2110. By then, it will be very difficult to govern. We must act quickly.

Figure 3. Global resilience in the period 1971-2017.
An interesting new indicator of the degree of development and efficiency of a system is the complexity-entropy ratio. Figure 4 portrays its evolution over the period 1971-2017. The ratio tells us how much development the world was able to produce for a given amount of generated disorder. This number has been dropping, but fortunately the rate has slowed down to almost zero over the past few years. The C/E ratio is also a proxy of the governability of a system. Systems with a very low C/E ratio are not easy to manage.

Figure 4. Global complexity-entropy ratio in the period 1971-2017.
As mentioned, complexity of evolving and growing systems increases. The fall of the Berlin Wall in November 1989 has become the symbol of the fall of communism in Central Europe. A few months before, in June, the first ‘almost free’ elections in an Eastern Bloc country were celebrated in Poland, paving the way to the first truly free elections in 1991. These events are reflected in Poland’s complexity in an astonishingly egregious manner – the plot is illustrated in Figure 5 (red arrow indicates the fall of the Berlin Wall in 1989).
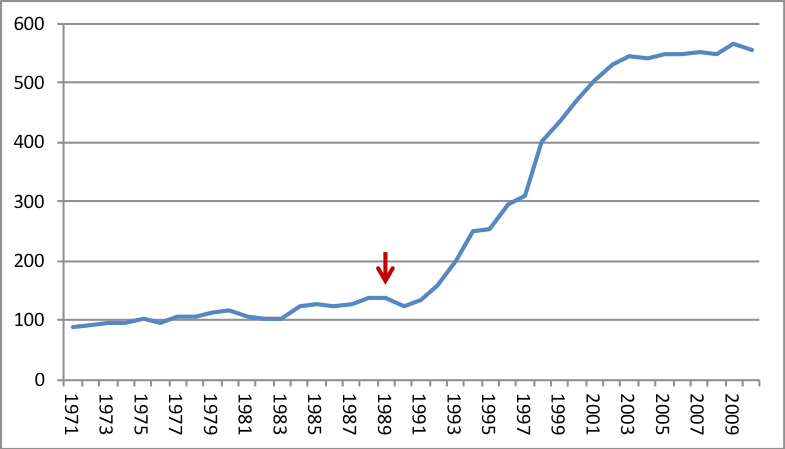
Figure 5. Poland’s complexity in the period 1971-2010.
In this context complexity provides a measure of the difference between a communist regime and a free economy. In the decades of communist rule, the country has evolved very little – complexity in fact grows at a very mild rate. Until 1980 the growth is almost exactly linear. In 1980, the Gdansk Agreement is signed and in December 1981 martial law is declared. This is when the first fluctuations in complexity commence. A decade of turbulence follows. In 1991, the year of the mentioned first free elections, complexity skyrocketed at rates never witnessed before. The growth is sustained until it stabilizes, almost suddenly, in approximately 2003. The country is now in an almost free market economy – complexity is approximately 550, five times what it was during the communist regime. The increase of over 500% provides an interesting measure of what a suffocating regime can do to a country and how a free market economy can quickly unleash its potential.

Hi Jacek,
The text mentioned red dotted lines in the harts. But they are not there.
Interesting that you used Poland as example how complexity increased as communist regime diminished. How china chart looks like? They r still communists. But actual economy is more or less captipalism. Their chart should see the sharp change after 1978ish. Then complexity increases and economical activities skyrocketed
Mike
Sent from my iPhone
LikeLiked by 1 person