
The management of crises, when based on data, relies on correlations that underly rules which, in turn, are translated into actions or regulations. If, for example, there were a strong correlation between driving speed and number of traffic accidents, this would lead to a rather obvious rule that “driving fast increases the risk of accidents”, hence the authorities would lower the maximum speed limit. This is indeed one reason why there are speed limits.
Something similar is taking place nowadays, when Covid-19-related data is used to trigger lockdowns, limit personal freedoms, reshape the global economy (to use a euphemism). Here too, correlations extracted from data are used for the purpose of supporting the said policies, or simply transmitting information to the public. In the majority of cases, linear (Pearson) correlations are used.
A recent study by John Hopkins University speaks of correlation between the number of covid-19 deaths and percentage of population with a BMI greater than 25 (i.e. that is obese). The image below has been extracted from the said report (see bottom of image for source)
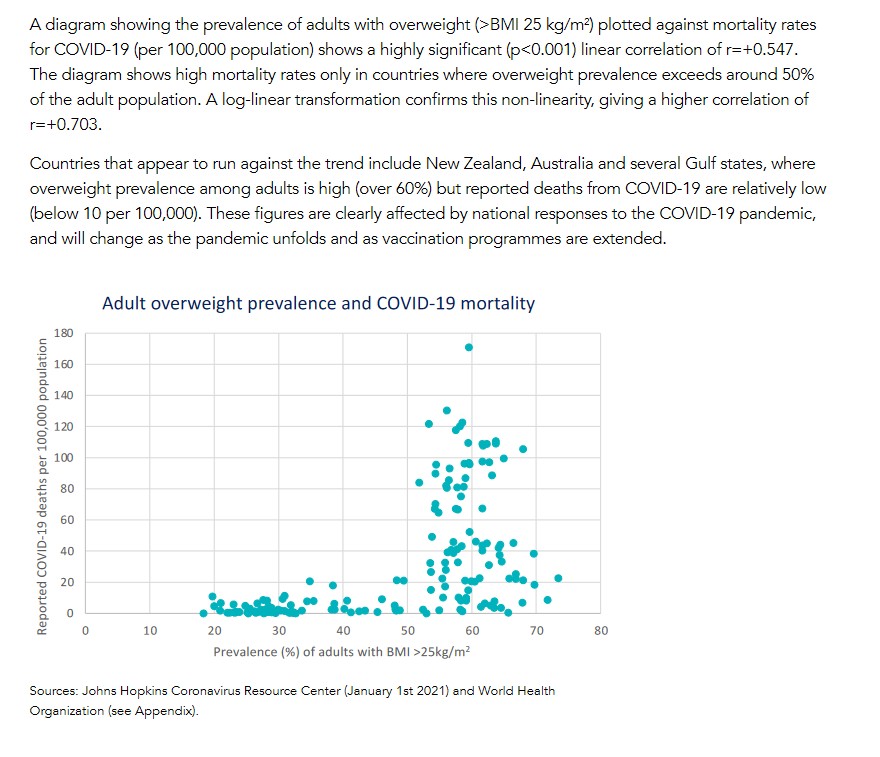
A “highly significant linear correlation coefficient of 0.547” is reported.
A more recent similar data set has been analyzed.

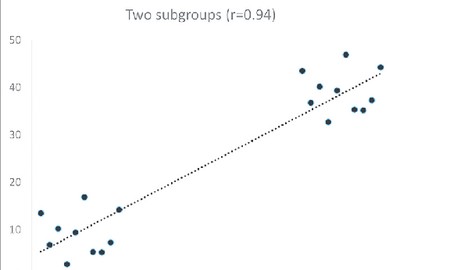
A linear correlation of 0.55 has been found. However, the said data clearly lacks any linear character and therefore linear correlation is not applicable to this sort of data. The example below shows how silly conclusions may be drawn based on linear correlations when these are not applicable. The 94% correlation in this case is absurd to say the least.
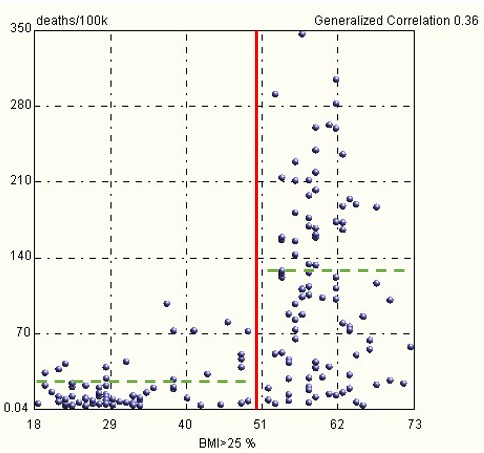
A generalized correlation of 0.36 has been computed using OntoNet. The 20% difference in correlation value confirms that this data lacks any solid structure. Any conclusions or actions taken based on data which lacks evident structure can be source of risk in that conclusions and rules drawn from such data will be quite weak.

In essence, to claim that there exists a correlation between the percentage of population with BMI>25% and number of Covid-19 deaths per 100.000 population is an extremely debatable statement. All that one can state in this case is that for values below 50%, the mean deaths per 100.000 are approximately 30, while for values greater than 50% it is around 130, see chart below.
To pull a straight line through such data and to conclude that there is a linear relationship between the two variables is disputable.

Reblogged this on muunyayo .
LikeLike