Topological robustness, due to the fact that it addresses the Process Map of a given system, is a global measure of robustness. Let us now look into more detail into the issue of robustness from a one and two-dimensional perspective. In other words, we will investigate the case of only two variables. This will help to appreciate better the concepts described above.
First of all, let’s focus on the simple “scalar” definition of robustness. The commonly accepted definitions of robustness mistakenly state that a system with low scatter in performance is robust. We state that a single-degree of freedom system behaves in a robust manner if its probability density function (PDF) is uni-modal. When the PDF is multi-modal – see figure below – the system (in the case of a particular variable or channel) can spontaneously jump from one peak (mode) to another.
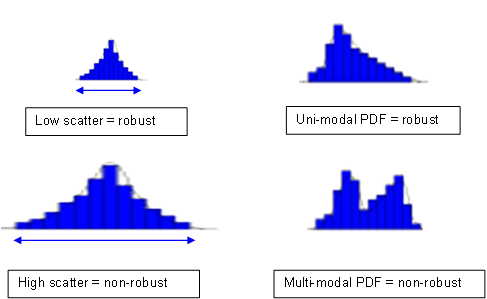
Fig. 1 Incorrect (left) and correct (right) definitions of robustness. Low or high-performance scatter points to high or low quality, respectively, and has little to do with robustness. Robustness is related to the character of the distribution, not to its spread.
Uni-modal distributions indicate systems which, for a particular channel, have only one most-likely response, or behaviour. In bi-modal or multi-modal distributions, a system can spontaneously deliver two distinct most-likely modes of behaviour. Therefore, one may see the departure from an equivalent Gaussian (uni-modal) distribution as a measure of simple, or scalar, robustness. The presence of multiple peaks in a PDF indicates clustering which, in turn, points to bifurcations. The fact that there exist clusters points to discontinuities or other pathologies in the input-output mapping. An example, shown in the figure below (Fig. 2), indicates how a rectangular region of the input space, when sampled uniformly is mapped onto a discontinuous domain in the output space. The white circle indicates an area of the output space where a bifurcation is present. This means that small changes in the values of the inputs may place the response on one of the two branches within the white circle. This may mean that the system changes behaviour or mode of operation. Evidently, such situations must be avoided.
The presence of clusters, or other discontinuities, indicates often that one is operating in a non-convex domain. A domain (set) is convex if a segment joining any two points lying within the border of the domain is contained entirely within that domain. Clearly, the output domain indicated in the figure below does not satisfy this condition, hence it is non-convex. We claim that non-convex domains are the primary source of non-robust behaviour.

Fig. 2 Example of input-output mapping obtained via Monte Carlo Simulation. The white circle indicates a non-convex area of discontinuity in the output space which should be avoided.
It becomes clear, at this point, that the amount of scatter does not point to robustness. It merely indicates quality. In other words, a high-quality product will exhibit small scatter in its operation. This means that any two products taken off the assembly line will be very similar in performance. Low quality, on the other hand, will be reflected in a non-repeatable delivery of performance or characteristics. The concept is summarized in two dimensions in the figure below (Fig. 3).
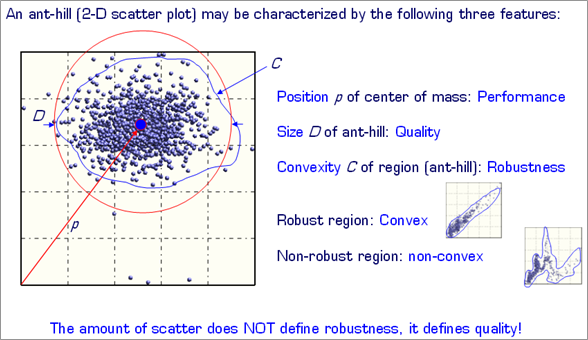
Fig. 3 Basic properties of a two-dimensional scatter plot: position, size and convexity.
In figure 3 the basic properties of a two-dimensional scatter plot (known also as ant-hill plot) are indicated. These are:
- Position of the centre of mass – this indicates the most likely performance of the system.
- Radius of the circle in which contains the domain – this is proportional to scatter and therefore reflects the quality of the system (if the two dimensions are relative to output parameters).
- Convexity of the domain – this is the property of the 2D domain which reflect the robustness of the system and its ability to spontaneously switch mode of behaviour.
A comparison of two systems operating in a non-convex and convex domain is illustrated below (Fig. 4).
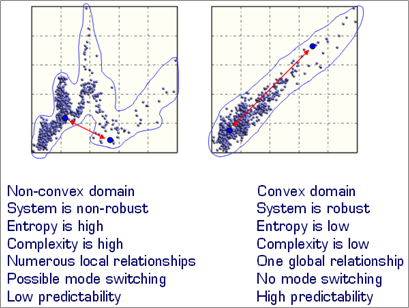
Fig. 4 Comparison of the properties of a non-convex (left) and convex domain (right).

Fig. 5 Examples of highly pathological non-convex output spaces. In such cases usage of statistics, interpolation Design Of Experiments or response surface methods doesn’t apply.
It must however be mentioned that convex systems can also lead to multi-modal PDFs. Two examples are shown below (Fig. 6).
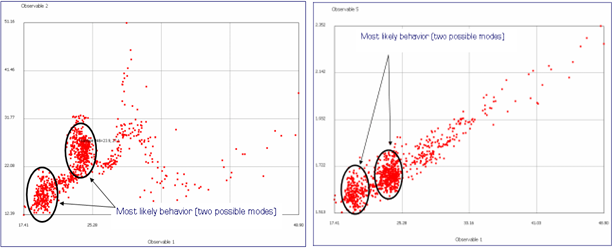
Fig. 6 Non convex (left) and convex (right domain). Even though the domain on the right is convex the presence of clusters suggests that multi-modal PDF can still be present if one considers the variables separately. In other words, convexity is not guarantee of uni-modal distributions (PDFs) of the output variables of a given system.

Reminded me what you did 20 years ago on that frontal crash problem, multi-mode, bifurcation. Your further exploration into convexity is awesome. I see it naturally expands or even replace what people mostly do, ie (assuming) single modal today…as we don’t know how the system behave beforehand.
LikeLike