The James Webb Space Telescope has delivered images of unseen quality.
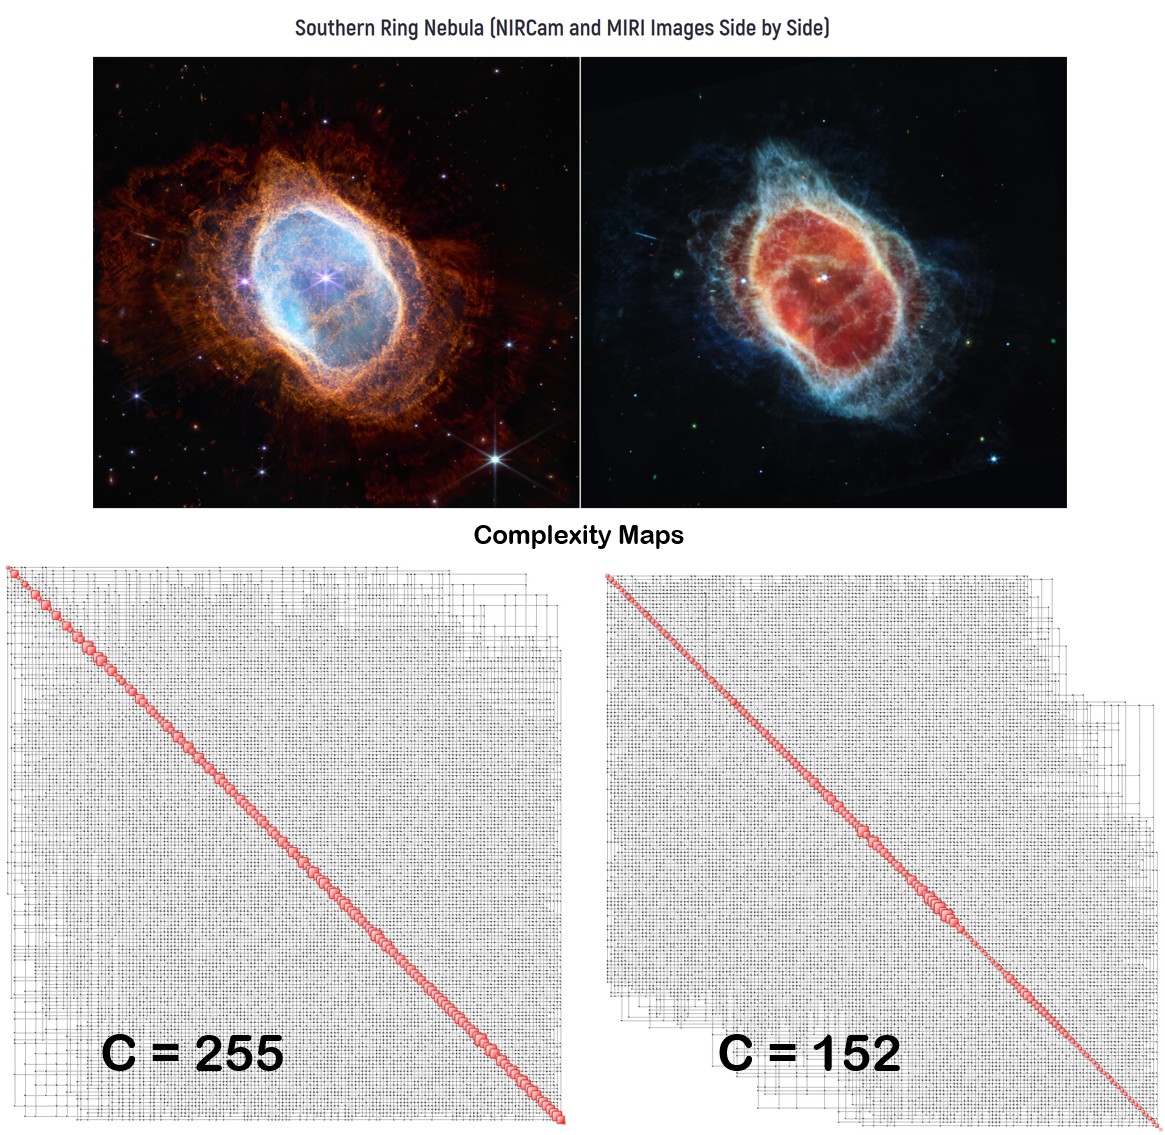
Two images, both of the Southern Ring Nebula in near-infrared light, at left, and mid-infrared light, at right, are confronted and analyzed using QCM tools. The idea is to measure their complexity, which quantifies the amount of structured information, i.e. information deriving from the fact that images contain local structures of pixels.
The idea is to measure the “distance” between these two images. How is this done? Quite simple. Complexity measures the total amount of structured information. This is expressed in bits. Based on the complexities of the two images (C=255 kb for the NIR image, and C=152 kb for the MIRI image) we can measure the difference in structured information to be around 67%. The picture belows shows both images as well as the corresponding Image Complexity Maps.
Another interesting experiment is to compare local properties of the images by means of a moving window sweep, from top to bottom. The window has a width of 24 pixels and moves down by one pixel at a time as shown below.

The result is illustrated below. It confirms that the NIR image (left) contains significantly more information – at least to the naked eye! – than the MIRI one. The orange curve corresponds to complexity, while the other two are, respectively, the lower and upper complexity bounds, which are not of interest in this very simple experiment.

The sweep shows how for both images, the NIR image is the more complex one.
The images look very different because NIRCam and MIRI collect different wavelengths of light. NIRCam observes near-infrared light, which is closer to the visible wavelengths our eyes detect. MIRI goes farther into the infrared, picking up mid-infrared wavelengths. The second star appears more clearly in the MIRI image, because this instrument can see the gleaming dust around it. QCM analysis can measure the difference between the two techniques in a new and original way.

0 comments on “QCM Analysis of James Webb Space Telescope Images”