The dangers of linear correlation arise when oversimplifying relationships between variables, leading to flawed conclusions, misguided decisions, or hidden risks, see recent blog. Here’s a breakdown of key pitfalls:
1. Assuming Linearity in Nonlinear Relationships
Risk: Linear correlation (e.g., Pearson’s r) quantifies only straight-line relationships. Many real-world relationships are nonlinear (e.g., exponential, logarithmic, or cyclical). However, linear techniques are used blindly without checking if a problem is nonlinear.
- Example:
- A drug’s effectiveness might plateau at higher doses (diminishing returns), but linear correlation would miss this threshold effect.
- Economic growth and inequality often follow a Kuznets curve (inverted U-shape), which linear models fail to capture.
Consequence: Missed patterns, poor predictive power, and invalid insights, wrong conclusions.
2. Confusing Correlation with Causation
Risk: A high correlation coefficient (r) does not imply causation. Hidden variables (confounders) or reverse causality often explain the relationship. In highly complex scenarios, the question of causality becomes irrelevant as usually many variables contribute to a given situation. There is no single cause.
- Example:
- Ice cream sales and drowning deaths correlate (both rise in summer), but heat—not ice cream—is the true cause.
- GDP growth and CO₂ emissions correlate, but industrialization drives both.
Consequence: Wasted resources on targeting the wrong variable (e.g., banning ice cream to reduce drownings), or neglecting the fact that CO₂ is mainly produced by natural processes.
3. Ignoring Outliers and Non-Normal Distributions
Risk: A single outlier can distort r, creating a misleading impression of strength or direction. The same may be said of clusters.
- Example:
- A billionaire in a neighborhood income dataset inflates the correlation between education and income.
- A rare event (e.g., a pandemic) skews the relationship between healthcare spending and mortality rates.
Consequence: Over- or underestimating relationships, leading to biased policies or investments.
4. Overlooking Heteroscedasticity
Risk: Linear correlation assumes constant variance (homoscedasticity). If variability changes across data ranges (heteroscedasticity), r becomes unreliable.
- Example:
- In finance, stock volatility often increases during market crashes, violating homoscedasticity assumptions.
Consequence: Inaccurate confidence intervals and flawed statistical inferences.
5. Masking Simpson’s Paradox
Risk: A correlation observed in aggregated data disappears or reverses when stratified into subgroups.
- Example:
- A university’s overall acceptance rate might favor men, but individual departments could favor women. Aggregating data hides this reversal.
Consequence: Erroneous conclusions about fairness, performance, or trends.
6. Neglecting Context and Domain Knowledge
Risk: Blindly trusting r without understanding the system’s mechanics or context leads to absurd conclusions. At the end of the day all methods which neglect physics are unreliable as they lack explainability.
- Example:
- A correlation between stork populations and birth rates (both linked to rural areas) doesn’t mean storks deliver babies.
- In healthcare, a correlation between hospital stays and mortality might reflect severity of illness, not hospital quality.
Consequence: Misguided interventions (e.g., culling storks to reduce births), wrong conclusions.
7. Overreliance on a Single Metric
Risk: Linear correlation reduces complex relationships to a single number (r), ignoring interactions, lag effects, or multivariate dynamics.
- Example:
- Climate change involves interactions between CO₂, methane, albedo, and ocean currents—no single correlation captures this.
Consequence: Incomplete models and failure to address systemic risks.
However, probably the greatest risk stems from the following:
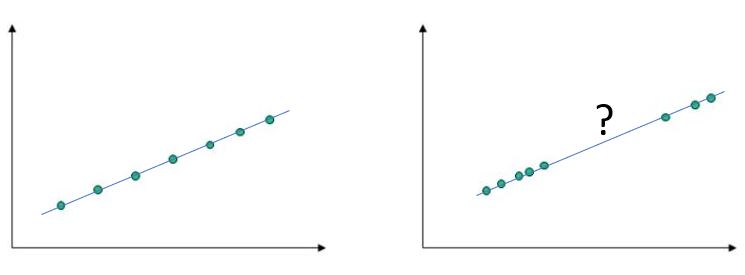
8. Assumption of Continuity
In the image below, linear correlations are both equal to 100% and, worse than that, the regression models are identical. Evidently, if one doesn’t actually see the underlying data and relies on the model, the consequences can be unpleasant. The model on the right hand side is not valid in the region between the two clusters. Assuming blindly that it is, is risky, to say the least. Continuity must be verified each time.
Natural phenomena are packed with discontinuties, outliers, bifurcations and anomalies. Forcing simplistic models on top of raw data must be done with great caution. Knowledge of physics offers fundamental protection against falling into the tempting traps inherent in data manipulation.
Linear correlations and regression models in general, are a useful tool but a dangerous master. Handle with care and keep away from small children.

Great article once again. I’ve learnt so much from you that I’d come to the understanding that people need to stop treating math as absolute truth without understanding the real-world physics behind it. Just because the math “works” doesn’t mean it tells the whole story.
LikeLike