

……….
Substantial evidence has suggested that this epidemic of ratings “errors” was not the product of mere negligence, but rather was the direct and foreseeable consequence of the credit rating agencies’ business models and their largely undisclosed economic partnerships with the issuers that paid them for their investment-grade ratings.”
Setting aside incompetence, the conflict of interest, the “special relationships”, etc. we wish to concentrate on what is probably the most fundamental reason for the “epidemic of rating errors” – the underlying flawed mathematical approach. Yes, the mathematics behind conventional risk rating is flawed not only from a purely mathematical and philosophical perspective, it also opens the doors to numerous means of manipulating the results. There are lies, damn lies and statistics. The tools offered by statistics – extremely dangerous if in the wrong hands – are the main enabler. In particular let’s look at the concept of correlation, the most fundamental quantity in anything that has to do with risk, ratings, VaR, its assessment and management.
A correlation measures how two parameters are related to each other as they vary together. Let us see a few significant cases:
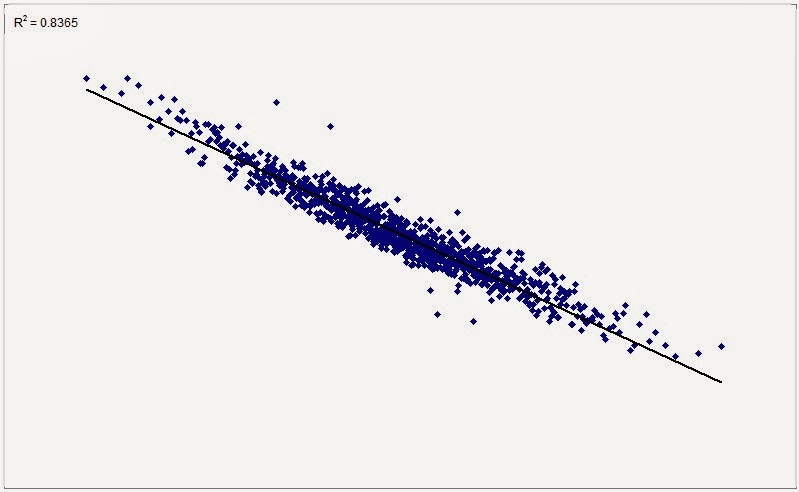
The above situation is quite frequent in textbooks or computers. In reality, this is what you encounter most often:
The problem becomes nasty when you run into situations such as this, in which R² = 0, but which, evidently, convey plenty of information:
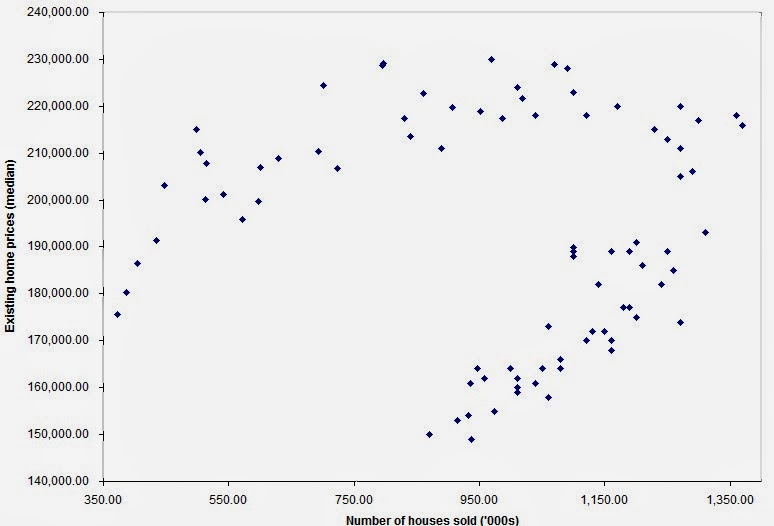
The evident paradox is that you have a clear structure and yet stats tells you the two parameters are independent. A clear lie in the face of evidence.
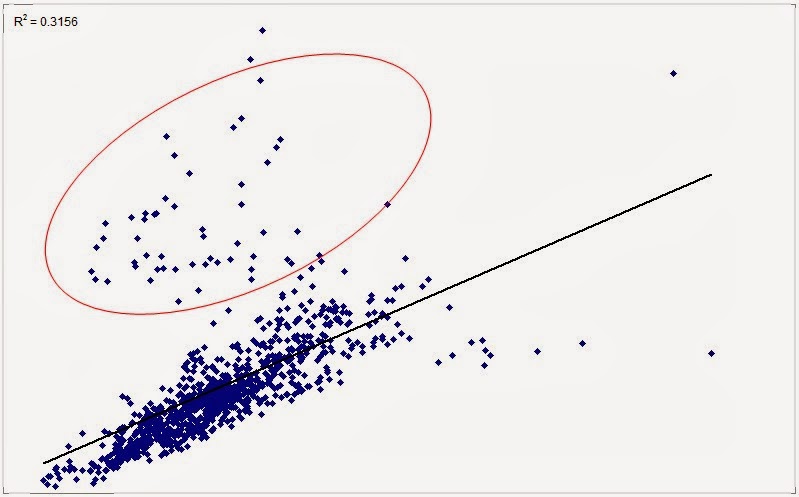
And what about cases like this one?

It is easy to draw a straight line passing through two clusters and call it “trend”. But in the case above it is not a trend we see but a bifurcation. A totally different behavior. Totally different physics. Two clusters point to a bifurcation, N clusters could point to N-1 bifurcations…. certainly not to a trend.
And finally, how would one treat similar cases?
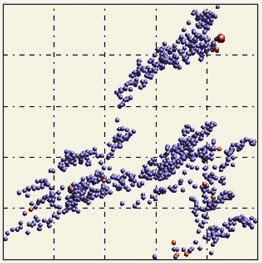
The data is evidently structured but correlation is 0. How do you deal with such situations?
The key issue is this: when looking at portfolios composed of thousands of securities, or other multi-dimensional data sets in which hundreds or thousands of variables are present, correlations are computed blindly, without actually looking at the data (the scatter plots). Who would? There are hundreds of thousands of correlations involved when dealing with large data sets. So, one closes an eye and just throws straight lines on top of data. Some false trends are captured as such, significant trends are discarded just because they don’t fit a linear model. What survives this overly “democratic” filtering goes to the next step, to create more damage. Imagine, for example, the MPT (Modern Portfolio Theory), developed by Markowitz and which hinges on the covariance matrix. Covariance is of course related intimately to correlation and the flaw propagates deeply and quickly. Think of all the other places where you plug in a covariance or a standard deviation, or a linear model. Think of how many decisions are made trusting blindly these concepts. We must stop bending reality to suit our tools. We have become slaves of our own tools.

0 comments on “Conventional Ratings: Why The Abysmal Performance?”