
 Traders and analysts judge market performance by looking at the values of stocks and indices. However, stock markets don’t have a rating, such as the companies listed on those markets. Have you ever wondered what the rating of the S&P 100 is? Is it AAA, or maybe BBB? How can you compute such a rating? Today this is possible thanks to new technology developed by London-based Assetdyne, which uses the closing values of stocks to compute the Resilience Rating of single stocks as well as of portfolios and markets. But let’s take one step back. There exists two main categories of ratings:
- PoD (Probability of Default) ratings
- Resilience ratings
A PoD rating measures the likelihood of default of a company and are known to the wide public as sequences of symbols such as AAA, AA+, B, CC, etc. These ratings have been conceived decades ago, in a world in which turbulence and globalization were unheard of.
Resilience ratings, on the other hand, have been engineered specifically for a turbulent and globalized economy and they measure the capacity of a business to withstand shocks, extreme events, heavy doses of uncertainty. Unlike a Probability of Default, resilience has a physical meaning and offers therefore a more objective reflection of the state of health of a business. Resilience is computed based on complexity, the idea being that excessive complexity is a source of fragility (i.e. the opposite to resilience).
So, let’s see how complexity of the S&P has been evolving over a period of ten years. The analysis has been performed with Assetdyne’s tools.
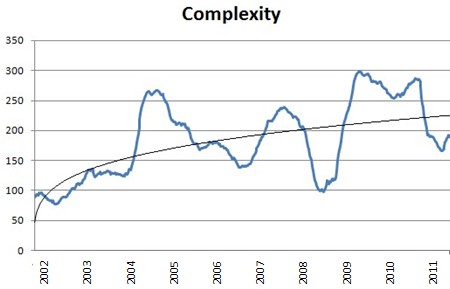 It is clear how complexity increases over time and how its fluctuations are increasing in amplitude. Stock markets are indeed becoming more complex and more unpredictable.
But what about the resilience of the S&P over the same period? Here is the plot.
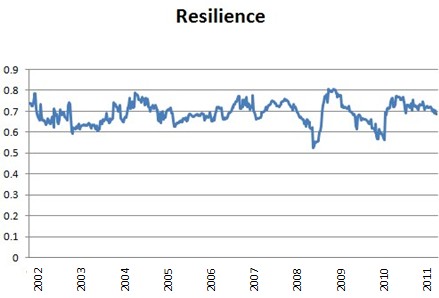
Resilience also fluctuates. Again, the amplitude of these fluctuations is higher, especially after eh start of the current financial crisis. This is how things look on the familiar AAA-D scale:
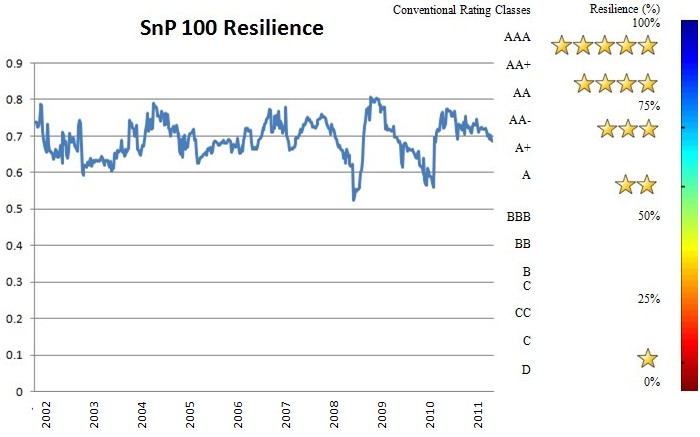 After the crisis has started in 2008, the rating dropped to BBB (equivalent to a 50% Resilience Rating), which is just a couple of notches from the so-called junk. Now things are looking a bit better. The latest S&P rating (computed on March 3-rd, 2014) was AA- (resilience of 70.6%, equivalent to 3 stars). Nothing to celebrate. Performance at the price of fragility. Maybe a result of printing money.
You may see the interactive Complexity Map of the S&P here.
Resilience Ratings of other major US markets are updated every two weeks and may be examined here.
And what about other markets?
NASDAQ – A+
Dow Jones Composite Average – AA-
Dow Jones Industrial Average – AA-
Dow Jones Utility – AA
Major Market Index – AA+
PHLX Semiconductor – AA-
PHLX Gold/Silver – A+

0 comments on “How Do You Rate an Entire Market?”