

Sustainability is a popular subject nowadays. Sustainability implies permanence, a sort of steady-state, almost some kind of equilibrium. However, in today’s world, speaking of permanence or steady state is a contradiction to say the least. From an energetic-thermodynamic standpoint a system or a process is sustainable if there is sufficient long-term energy supply to keep it running (possibly without damaging side-effects). But the question is, sustainable for how long? And with which efficiency? Inefficient systems can function for a long time, as long as energy is supplied. So when politicians or economists speak of sustainability, what do they really mean? What is really meant when we hear “eco-friendly and sustainable”? Are we speaking of 50 years, 100 years or more? And what about efficiency? Does sustainable also mean highly efficient? Are we looking at 30%, 70%, or 90% efficiency. One thing is clear – in order to speak of and to “manage sustainability” one should be able to define it and measure it or, in alternative, provide some proxy thereof. Managing something means measuring that something in order to drive its value to some desired target. Otherwise, it’s just talk. Serious science starts when you begin to measure.
Good metrics start with good definitions. In Wikipedia one finds this:
“Since the 1980s sustainability has been used more in the sense of human sustainability on planet Earth and this has resulted in the most widely quoted definition of sustainability as a part of the concept sustainable development, that of the Brundtland Commission of the United Nations on March 20, 1987: “sustainable development is development that meets the needs of the present without compromising the ability of future generations to meet their own needs.”
That is about as imprecise as it can get! How do you measure and manage that? A good definition is one that hints a metric. The one above doesn’t.
Sustainability hinges on the following four “systemic attributes”: Resilience, Interdependency, Complexity and Entropy. All these factors impact Governability, without which little can be achieved. These attributes need to be measured if we want to speak of sustainability in a new, systemic and quantitative fashion.
Wikipedia defines “resiliency thinking” as:
“Resiliency in ecology is the capacity of an ecosystem to absorb disturbance and still retain its basic structure and viability. Resilience-thinking evolved from the need to manage interactions between human-constructed systems and natural ecosystems in a sustainable way despite the fact that to policymakers a definition remains elusive. Resilience-thinking addresses how much can planetary ecological systems withstand assault from human disturbances and still deliver the services current and future generations need from them.” How can this be applied practically to the World as a system?
Based on data from the World Bank we have measured the resilience of the World (as described by over 1000 variables spanning the economy, education, healthcare, transportation, energy, etc.) over the past 5 decades. The result is illustrated below (Global Resilience Index™):
.
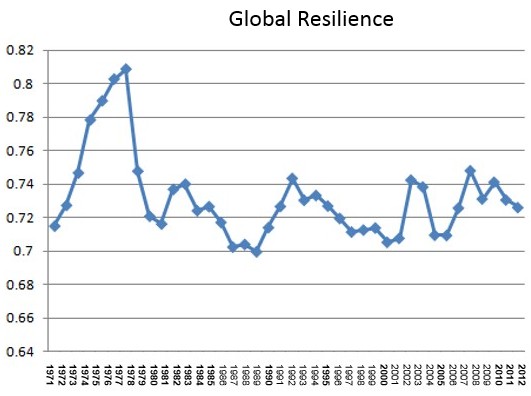
The world as a systems seems to be stabilizing at approximately 70% resilience. This value coincides with that of the vast majority of countries and macro-regions which we have analyzed. Is 70% sufficient for long-term sustainability of our global society/economy? If we don’t expose ourselves to shocks and disasters it very well could be, but how do you guarantee that? Evidently, high resilience comes a cost in terms of performance, flexibility, efficiency and adaptability.
Because the world is interconnected – today the degree of interdependency is 62% – any discussion of sustainability must be of global systemic nature. As interdependency increases, local isolated analyses will become less relevant and a broad-scope analysis is therefore mandatory. It is not only the economy which binds us all, it is also travel, telecommunications, migrations, international finance, as well as conflicts, climate, natural disasters, etc.
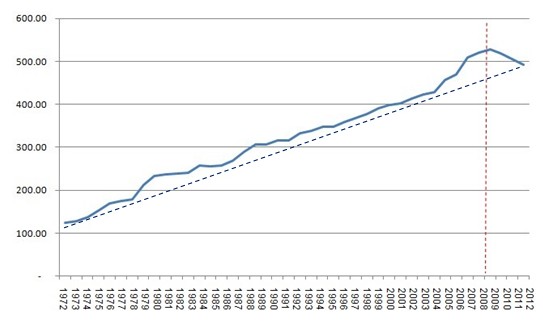
Complexity, which is measured in cbits (or complexity bits) is a measure of development, sophistication and evolution. A system which evolves becomes more complex – think of our biosphere – and can perform more functions. The complexity of the World has been growing more or less steadily over the past five decades. This is illustrated in the graph below which shows the evolution of the Global Complexity Index™. Data from the World Bank has been used in our analysis. Over 260000 parameters have been taken into account from 196 countries. The bumps correspond to crises or destabilizing events. The most prominent of these is the current crisis which had started to build up in 2004. The drop which started in 2008 gives an idea of how severe the crisis is.
But let’s turn our attention to entropy. The creation of entropy (“waste”, chaos, disorganization) is inevitable every time we transform energy to perform work. Development, growth and evolution inevitably involve the creation of entropy. Until 1998, for nearly three decades, entropy has been increasing at a steady pace, just like complexity. In approximately 1997 the rate of entropy production (the entropy gradient) has increased dramatically – see change of slope indicated by the second red dotted line. In practice, until 1998, the Entropy/Complexity ratio has been constant. After 1998 the ratio more than doubles. In 2001, after 9/11, the World changes dramatically. With all likelihood, 9/11 has consolidated the change – entropy is now growing very quickly: for each increase in complexity (growth) the amount of waste that is produced increases by 100%. This is what happens at global, planetary level. In a recent blog we identify the possible causes of this increase in entropy production. These causes have a lot to do with society, less with economy.

A new systemic index can now be introduced: the Entropy/Complexity gradients ratio which reflects the efficiency of a system. Basically, the E/C index measures how much waste is generated for a unit of development or growth. Since approximately 1998 the index doubles, from 20 to 40, meaning that our society needs to produce twice as much waste for a unit of development as it did in, say, the 70s or 80s. The evolution of the E/C ratio is depicted below:

It is still too early to say if the current E/C value of 40 is excessive and for how long it can be maintained. However, the fact that it has doubled almost suddenly isn’t a good omen.
In terms of single countries – which have been analyzed adopting similar parameters (data source: World Bank) – the situation in 2012 has been the following:

Complexity is a measure of vitality, sophistication and intricacy from a general perspective. Ultimately, it reflects the culture of a country. Countries with higher complexity may be viewed as more “advanced” (not technologically!) but also less governable. Implementing reforms in such countries may be more difficult.
From a complexity perspective, Italy, USA, France and Germany are the most “advanced” countries.
Entropy, as mentioned, measures the amount of “waste” – again, the term is used in a very broad sense – and there are countries which clearly produce more than the average: Italy, USA, Germany, France and India. Singapore, on the other hand, is far less entropy-heavy but it is also significantly less complex. Japan is in a similar situation. In both these countries many systems function like ‘clockwork’.
From an “efficiency” point of view, i.e. based on the E/C ratio, which measures the amount of waste per unit of development, Italy, Germany, France and China present the best credentials. USA and Japan have the worst E/C ratio. The Eurozone, surprisingly, boasts a ratio of 310, well below that of its largest member states (so much for linear thinking!).
In conclusion, the E/C ratio may be a proxy of sustainability or sustainability-potential. High values indicate that a particular country is “inefficient”, potentially vulnerable. In such cases, sustainability may be more expensive to achieve and maintain. Countries with high complexity are generally more advanced – their inhabitants may be more receptive to reforms necessary to lead to a more sustainable less wasteful lifestyle – but are also less governable. Finally, since the E/C ratio is a general feature of any system, it may be applied to measure the sustainability potential of corporations and to measure their impact on society in a more comprehensive measure than the CO2 footprint.

Pingback: How Sustainable is the World as a System? | Ontonix QCM Blog