

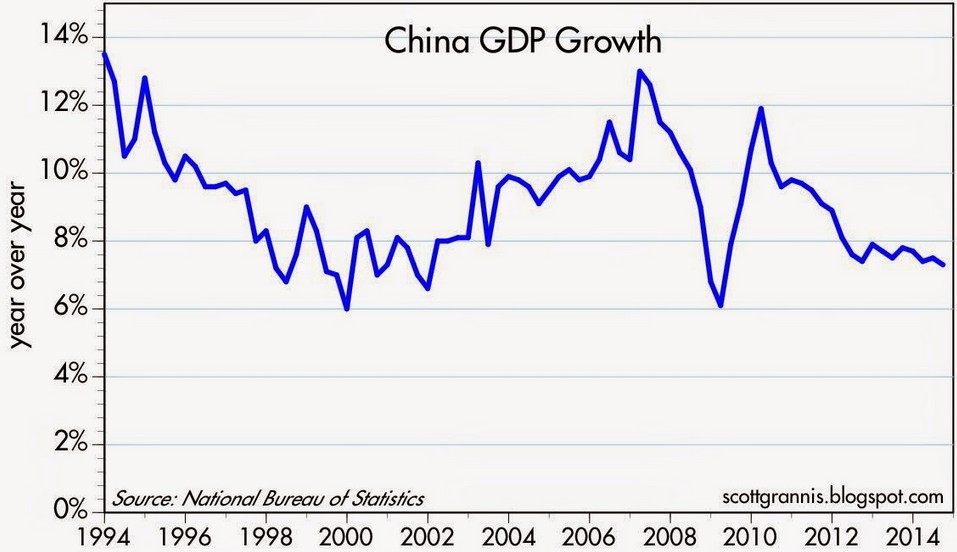
China has made headlines recently when it devalued the Yuan and when its stock markets fell. By mid-July the Shanghai market was down by about 30%. At the end of July another fall of over 8% has been recorded. The stocks of global companies that rely on the Chinese market lost approximately $ 4 trillion. This blog doesn’t have the objective of analyzing the causes of the bubble. What is of interest is the dynamics and, most importantly, the systemic aspects of the Chinese economy. China’s footprint on the global economy is large and therefore the issue today is not to figure out when the Chinese markets will recover – they will, sooner or later – but to understand if this is just a hiccup or something deeper, something more ‘systemic’ in nature. The evolution of the GDP growth rate – the analyst’s favorite – reflects only part of the story. According to the plot below, China’s GDP growth rate fell sharply in 2007 to a ‘mere’ 6%, peaking again at 12% in 2010. After 2010 a steady decline commenced, leveling off just below 8% in 2014.
The GDP and GDP growth rate are systemic parameters but they lack a fundamental dimension, namely they disregard the structure of the economy, its complexity, inter-dependency and resilience (robustness). Let’s first look at complexity. Complexity represents a fundamental property of all systems, both natural as well as man-made. Measured in cbits (‘complexity bits’) is quantifies the amount of structured information and reflects the ‘potential’ of a system, its degree of development and evolution. All systems that grow and evolve become progressively more complex until aging stops and reverses the trend. Consider the biosphere and how it evolved from a primordial ‘soup’ of amino acids to today’s astonishing biodiversity in which millions of species interact and co-evolve. A system which is ‘saturated’ or inefficient, or which simply stops growing, may be recognized by a low complexity growth rate or even a decline. In the case of China, the evolution of its complexity over the past three decades is depicted below. The analysis, however, is not based on economic parameters. Instead, it takes into account all of the development indicators provided by the World Bank and takes into account aspects such as finance, energy, education, healthcare, energy production/consumption, demographic aspects, education, pollution, transportation, telecommunications, crime, etc. There are over 1300 indicators, spanning every aspect of a country, not just its economy. In other words, we’re looking at a truly holistic analysis of a country.
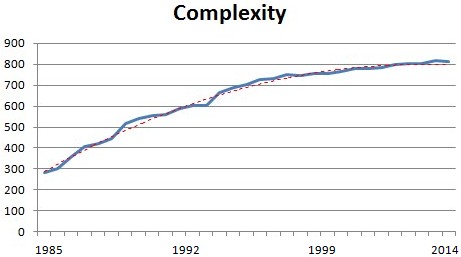
The above plot shows how the rate of complexity growth (i.e. the complexity gradient) has been declining progressively, in particular after the late 1990s it almost tends to zero. This means that from a systemic point of view, the country has reached some sort of ‘physiological limit’. This means that in certain directions the system may still be growing while shrinking in others, but, as a whole, it is in a state of ‘equilibrium’ or saturation. Imagine a liquid which continues to receive heat until it reaches its boiling point, after which it just continues to boil.
The evolution of resilience (robustness) shows clearly how the system has reached a state of equilibrium in the mid 1990s, at approximately 72%, pretty much in line with most of the important economies. This is not totally unexpected. In view of the high degree of inter-dependency (today it is approximately 77%) all economies are tightly connected.
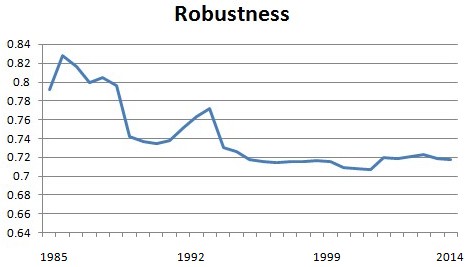
A resilience of 72% is nothing to celebrate even though it is not an alarmingly low figure. In fact, the major economies in the Eurozone register a very similar level of resilience. In terms of credit rating S&P rates China at AA-. But that’s just the credit rating. It says nothing of the country as a system. A resilience rating of just under 72% is equivalent to an A+ when projected onto the conventional rating scale.
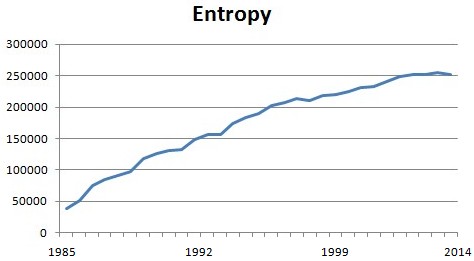
The slowdown of China has really begun in the late 1990s and nothing in the complexity chart hints anything other than ‘equilibrium’ with a dose of ‘chaos’ (disorder). The amount of disorder in a system is measured by entropy. The entropy plot is shown below. It too points to a steady rate of entropy production until the late 1990s. Then the rate decreases visibly. Clearly, a system which slows down its growth and evolution – by evolution in this case we mean the creation of structure and functionality – it also produces less ‘waste’ (i.e. disorder). Since 2010 entropy production is constant, in accordance with the complexity plot above, and confirming a situation of a fairly stable ‘equilibrium’.
 Based on the above results we can state that at present there is nothing that would hint an improvement in the short/mid-term. However, China is part of the global economy which has a lower resilience and with which it interacts. At the time of writing (19-th September, 2015) the Global Financial Resilience Index (GFRI) is at 59% (equivalent to an A) after it dropped suddenly from 68% a few days ago. Unless a full systemic analysis of the entire global economy is performed it will not be easy to determine to what extent China’s hiccups will affect the other major economies. And vice-versa.
The slowdown of China as a system – we’re not talking of just the economy – has really begun in the late 1990s. It is true that in today’s economy things change very fast. However, it is also true that super-huge systems have huge inertia and their dynamics is slow. This is why stock markets can recover after a crash much more quickly than the real economy .

For our Asian Readers in Vietnam: http://www.stockbiz.vn/News/2015/10/1/605216/co-may-kinh-te-trung-quoc-da-thuc-su-bat-dau-giam-toc-tu-khi-nao.aspx
LikeLike