
Innovation is the result of R&D which is something that requires vision, strategy, leadership, will-power, money, persistence, continuity. Vision requires solid preparation and plenty of knowledge. You don’t get great visions or flashes of intuition under a shower unless you’re obsessed with something and unless you’ve put plenty of time and effort into it. There is no free lunch in this sense.
Many large corporations are focused on short-term performance and management bonuses and, if that were not enough, when profits fall the first thing they cut is R&D precisely because it delivers long-term results (if and only if things go well). Companies that focus on short-term profit are generally in trouble. After the first 2-3 quarters of great results come the first cold showers. Clearly, they cut on R&D. Does the above cartoon sound familiar?
Radical innovation may lead to a paradigm shift. According to Thomas S. Kuhn, paradigms change after a revolution. A revolution takes place when there is a (big enough) crisis. How do you recognize that there is a crisis, for example in a scientific (or any other) discipline? Fragmentation. When people run out of ideas, they fragment and fractalize the same old ideas.
An example from finance. We have analyzed recently all of the indices of one of the European stock exchanges. Each stock exchange is known thanks to a few important indices. For example on Wall Street there is the NASDAQ, the S&P or Dow Jones and a plethora of less ‘glamorous’ indices. In the mentioned case of a European stock exchange, there are 47 indices, including a well-known main index. The Complexity Map of this stock exchange is the one depicted below.
.
What is evident is that the map is almost full (the density is 83%!) meaning that most of the indices are correlated with most of the remaining indices. Whenever you examine a system, any kind of system, which is described by a set of N variables, take a look at its Complexity Map. It reveals the structure of information ‘contained’ in the said description. If the map has very high density, such as in the mentioned case, be warned.
The very high map density suspicious to say the least. But let’s take a look at some of the interdependencies (the small black dots in the map) between these indices? We randomly picked two.
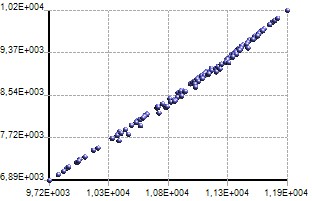
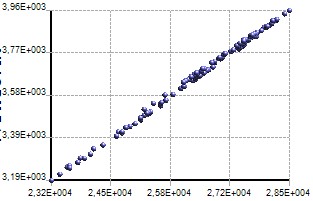
In both cases, one index repeats the information carried by the other. That’s exactly what a generalized correlation of 95% (linear Pearson correlation yields values of 98% or more) is telling us. In other words, if you have one index, you don’t need the other as it simply repeats information you already have. In the above map, most interdependencies are of this type. Basically, of the 47 indices, the first 10, maybe 12, define the whole thing, the rest are simply redundant, superfluous, pleonastic. It is true that a sub-index may be necessary in order to define certain financial products. However, today there are more elegant and modern ways of achieving this. Remember, if x and y are independent variables which carry a certain amount of information, z = x + y doesn’t create new information, nor does z = 2x + 3y, or z = 5x, or any other variation thereof. Linear combination is not R&D, it is not progress, it is not innovation. It is plain-vanilla fragmentation. Unless you step away from a problem and see it in a different light you won’t realize that linear ‘geocentric’ thinking, bigotry and orthodoxy can only take you that far. There is no free lunch.

0 comments on “How to Distinguish Innovation from Fragmentation?”