

In the past few weeks stock markets have been plummeting. There is talk of a perfect storm. On May 18-th our blog hinted the possibility of a generalized market collapse in virtue of low levels of the Global Financial Resilience Index (GFRI) and its downward trend. With falling oil prices, a troubled banking system, low inflation and growth, the situation is complex. What is the investor supposed to do?
In general, it is a good idea to stay away from highly complex situations. This is because in a highly complex scenario there are many possible outcomes – these are called modes (attractors). Some may be good, some may be catastrophic. In highly complex scenarios, it is very easy to jump from one mode to another. In the case of stock markets, this means that the distance between making money and losing money is very small.
The situation gets worse if, in a highly complex and turbulent market, one deals with highly complex products. This produces a multiplier effect and leads to very fragile outcomes. The distance between profit and loss becomes indeed very small. Therefore, in order to mitigate the situation, the less experienced investor is better off by staying away from highly complex financial products. It is often said that derivatives, for example, are complex. First of all, the complexity of a product – or any system for that matter – is reflected by the way it behaves, not by the way it is designed. Second, a product might behave in a complex manner for a period of time but then switch to a simpler behavior. Things rarely stay the same. As they say, you can’t step twice into the same river. Consequently, the complexity of stocks, funds, derivatives or other financial products should be checked on a certain basis.
To help investors we analyze on a daily basis over 5000 tickers and report their complexity. A simple online tool provides the corresponding complexity categorization. An example (February 5-th, 2016) is illustrated in the table below.

The information is very simple to interpret. High complexity means that surprises are more likely. A stock with highly complex behavior can suddenly jump up or fall. For sure, this can happen with any stock but higher complexity implies higher chances of surprises.
For example, the price of Volkswagen stock (reported ‘Medium’ on February 11-th, 2016) has a reasonably mild evolution. Its dynamics is not highly complex as reported below.

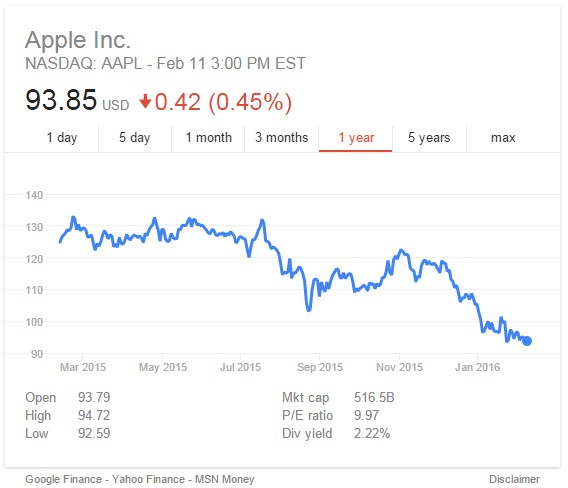
The case of Apple is different. The dynamics of Apple’s stock is more rugged – it is also intuitively more complex. The complexity of the stock’s evolution (i.e.its dynamics) is ‘High’ (February 11-th, 2016) which means that it may surprise investors.
It is interesting to examine the distribution of the complexity of the said 5000+ tickers. The distribution, reported below, is bi-modal, which points to two ‘attraction basins’. There are many low complexity stocks – complexity of 10-15 – but there are also numerous stocks with high complexity – 55 to 60. As a general rule, inexperienced investors may want to stay away from highly complex stocks or financial products.
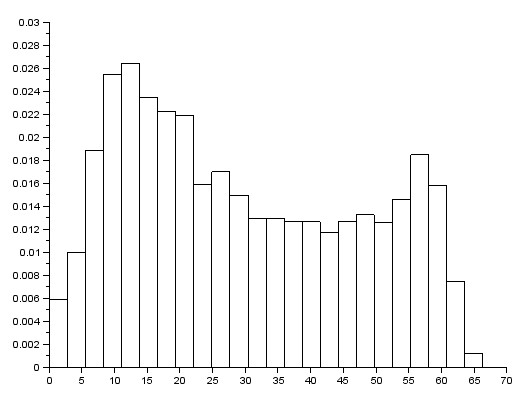
Clearly, the shape of the above distribution is not fixed. It too changes with time. This is why the complexity of anything that is traded should be checked on a frequent basis.
In summary:
- Complexity measures the degree of sophistication of the dynamics of a stock
- Highly complex dynamics is more difficult to predict
- Highly complex dynamics is less intuitive
- High complexity means that surprises are more likely
- In highly complex situations, conventional tools provide less relevant results
- Complexity is a new, modern measure of volatility, designed specifically for a turbulent economic regime.
More soon.
Below, dynamic representation of Dow Jones Complexity Map spanning 24 trading days.
By JM.

0 comments on “In a Storm Stay Away From Complex Stocks”