From: https://www.kaggle.com/c/seizure-detection
“Of the more than two million Americans who suffer from recurrent, spontaneous epileptic seizures, 500,000 continue to experience seizures despite multiple attempts to control the seizures with medication. For these patients responsive neurostimulation represents a possible therapy capable of aborting seizures before they affect a patient’s normal activities.
In order for a responsive neurostimulation device to successfully stop seizures, a seizure must be detected and electrical stimulation applied as early as possible. A seizure that builds and generalizes beyond its area of origin will be very difficult to abort via neurostimulation. Current seizure detection algorithms in commercial responsive neurostimulation devices are tuned to be hypersensitive, and their high false positive rate results in unnecessary stimulation.
In addition, physicians and researchers working in epilepsy must often review large quantities of continuous EEG data to identify seizures, which in some patients may be quite subtle. Automated algorithms to detect seizures in large EEG datasets with low false positive and false negative rates would greatly assist clinical care and basic research.”
An approach based on complexity has been adopted. In particular, the case depicted below has been analyzed. EEG was sampled from 16 electrodes at 400 Hz, and recorded voltages were referenced to the group average.
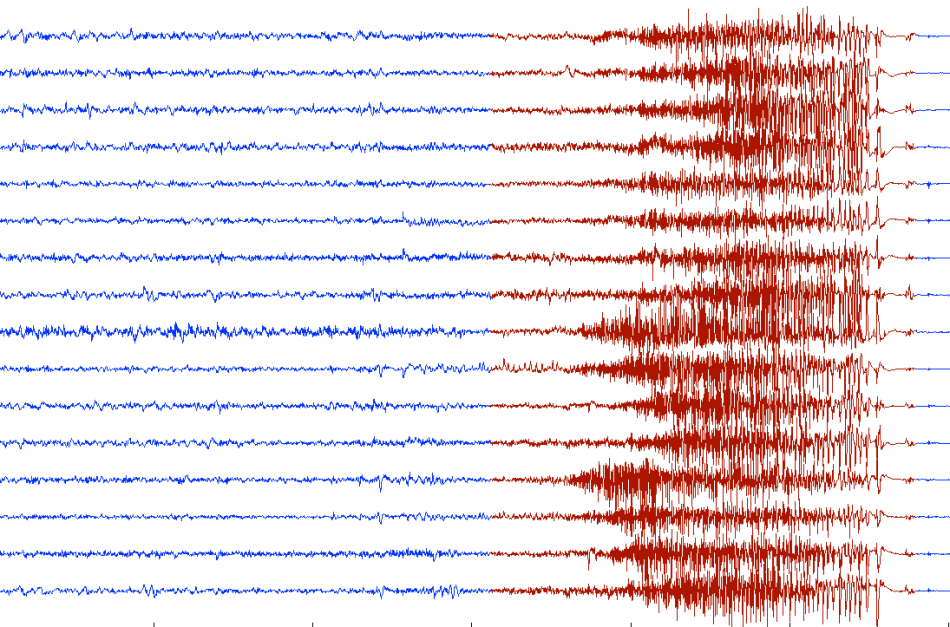
Instead of performing a conventional analysis of the EEG data, the above image has been analyzed as such, i.e. we got our QCM algorithm to ‘look at it’, in vertical strips of 50 pixels. In essence, an ‘analog’ analysis of the EEG has been run by processing a moving window-image instead of data. The results are shown below.

The three curves below the EEG represent the complexity bounds (red and blue curve) while the middle curve is complexity.
Not only does this method detect seizure – complexity starts to rise quickly – it also provides an early warning with an anticipation at least equal to duration of the actual seizure. The black dashed line indicates when complexity starts to rise, while the red one corresponds to the onset of seizure.
The peak value of complexity may be used to measure the severity or intensity of the seizure. In alternative one could use the complexity gradient (rate of change) or the area under the complexity curve for the purpose.
This example illustrates not only the capacity of QCM to anticipate systemic collapses but also shows how an ‘analog’ approach – which we use to establish the value of generalized correlations by analyzing scatter plots transformed into images – can provide a very fast alternative to other methods, such as Artificial Intelligence. In fact there is no need to train a system to recognize anything. Phenomena such as seizures, earthquakes, or other natural events, if monitored properly, can provide crisis precursors if the structure-entropy interactions which take place are identified. This is AI 2.0.
Rising complexity is a common precursor of crises. Detecting and recognizing seizures or fibrillations is already a feat. Why do you think that Implantable Cardiac Defibrillators sometimes give unnecessary shocks? Machine learning systems are only as good as the training set used for the learning phase. With complexity there is no training, no learning and it works with thousands or millions of variables. Complexity is able to answer the question “are we under attack?” without knowing what kind of attack it is.
BTW, don’t try this with linear techniques – it won’t work!

Pingback: New Complexity Metrics and Early Warnings | ONTONIX QCM Blog
Pingback: Complexity Anticipates Ventricular Tachycardia | Quantitative Complexity Management