

Just to put things in perspective:
“Overall, the CDC estimates that 12,000 and 61,000 deaths annually since 2010 can be blamed on the flu. Globally, the World Health Organization (WHO) estimates that the flu kills 290,000 to 650,000 people per year.” Read full article. The dispersion, 290,000 to 650,000 is significant.
We have run a complexity analysis of the latest corona virus data – see source. Data is from March 2-nd, 2020. Results are presented without comments of clinical nature.
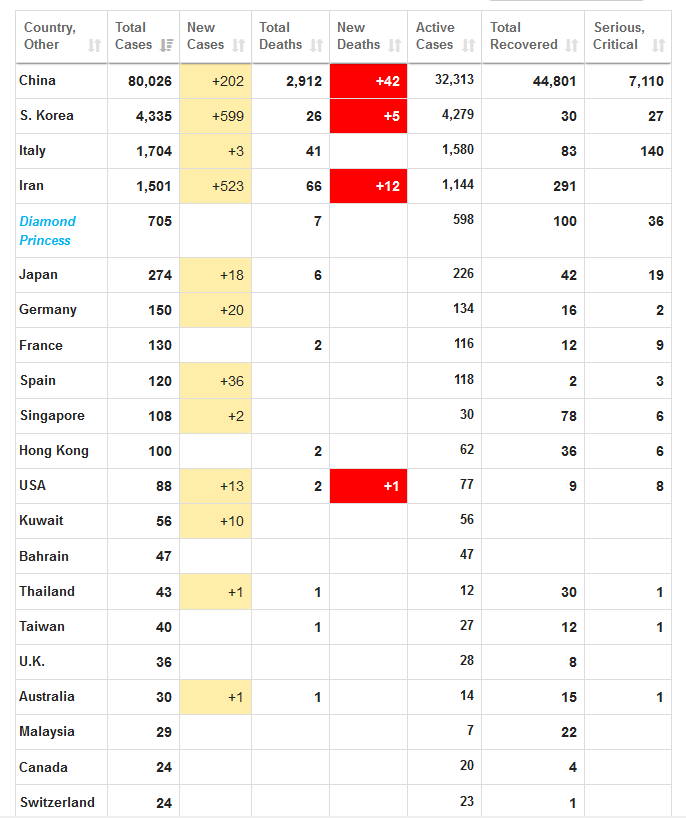
The data is question is as illustrated in the table below.
Two analyses have been run:
- Entire data set
- Entire data set minus China, Korea and Italy
The corresponding Complexity Maps are illustrated below.
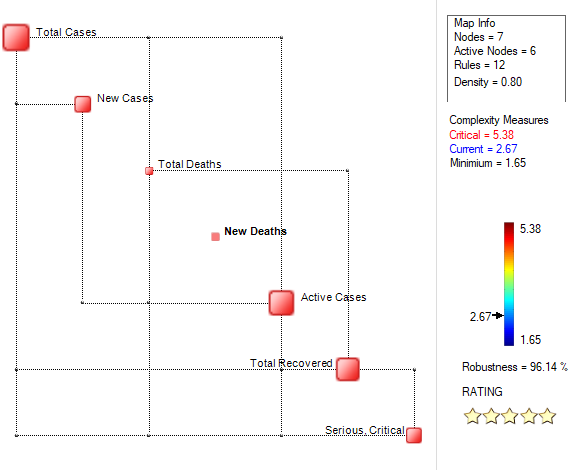
Entire data set.

Note that the resilience (robustness) is 99.6%, pointing to a very stable situation. The “Total Recovered” is a clear hub, i.e. dominant variable.
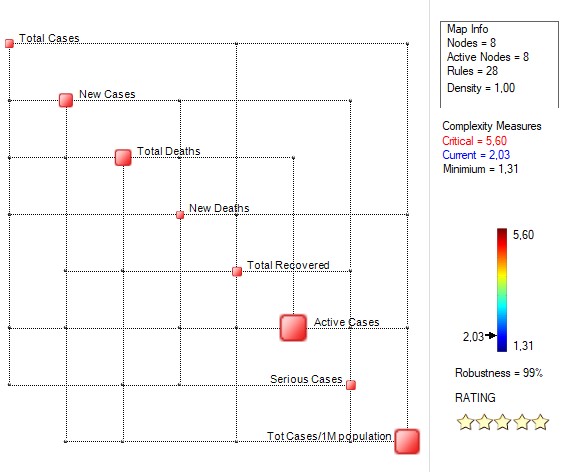
Entire data set minus China, Korea and Italy.
Resilience is still very high, 96.1%. Hubs in this case are “Total Cases”, “Active Cases” and, most importantly, “Total Recovered”. The “New Deaths” variable is uncorrelated with the other variables.
In both cases, based on the current data, one may state that the situation is highly stable. One can therefore expect that in the near term there will not be any surprises.
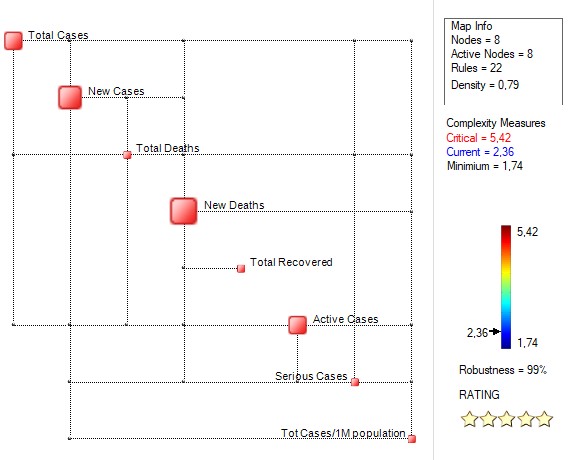
It is to be noted, is that in both cases complexity is close to the lower bound (minimum complexity) pointing to a situation devoid of chaos. Similar conclusions may be drawn from the total deaths count reported in the cited source):

Updated analyses shall be reported once new data becomes available.
Update on March 10-th, 2020.
The Complexity Map, based on data from Italy, South Korea, Iran, France, Germany, Spain and the USA, and excluding China is illustrated below:

Active Cases and Total per 1 million population, are the hubs. The robustness (resilience) is still very high, 94.6%, meaning the system is far from being chaotic.
When data is transposed, the following result is obtained:

It is curious to note that Iran is the hub.
Update on March 17-th, 2020.
With close to 200 thousand infected and close to 8000 deaths, the situation, excluding China, which has basically no new reported cases, is as follows:
Resilience is at 99%, meaning that, based on the available data, the situation is stable and predictable. High resilience doesn’t imply the situation is good or bad, it simply means that sudden disruptions, or surprises, are not likely.
Excluding the top 4 countries with the largest number of infected individuals, the situation is as follows:
Resilience is still at 99%, even though the hubs have changed.
Updated on March 25-th, 2020.
Analysis of Italian data, complexity map illustrated below.
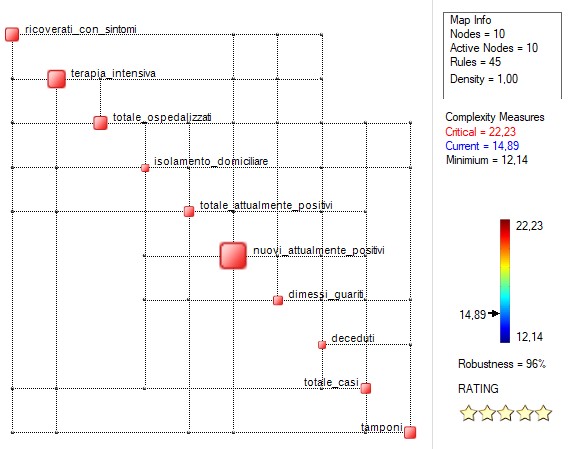
Resilience is still at a very high 96%. The situation, based on the available data, is not likely to deliver surprises.
Updated on April 7-th, 2020
The resilience continues at very high levels – 96% – pointing to a controllable situation.
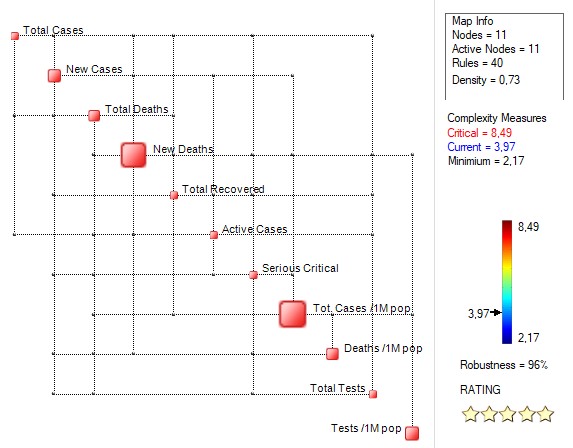
Updated on May 24-th, 2020
The Complexity Map below reveals France as being a hub – this points to a high degree of interdependency with other countries – with a resilience of over 99%. This points to a very stable situation, in which surprises are quite unlikely.


0 comments on “Is the Coronavirus Situation Under Control?”