
From Wikipedia:
The 2020 stock market crash was a global stock market crash that began on 20 February 2020. On 12 February, the Dow Jones Industrial Average, the NASDAQ Composite, and S&P 500 Index all finished at record highs (while the NASDAQ and S&P 500 reached subsequent record highs on 19 February). From 24 to 28 February, stock markets worldwide reported their largest one-week declines since the 2008 financial crisis, thus entering a correction. Global markets into early March became extremely volatile, with large swings occurring in global markets. On 9 March, most global markets reported severe contractions, mainly in response to the COVID-19 pandemic and an oil price war between Russia and the OPEC countries led by Saudi Arabia. This became colloquially known as Black Monday. At the time, it was the worst drop since the Great Recession in 2008.
During March 2020, global stocks saw a downturn of at least 25%, and 30% in most G20 nations.
Complexity tends to peak, or increases rapidly, prior to a crisis. Financial markets are no exception.
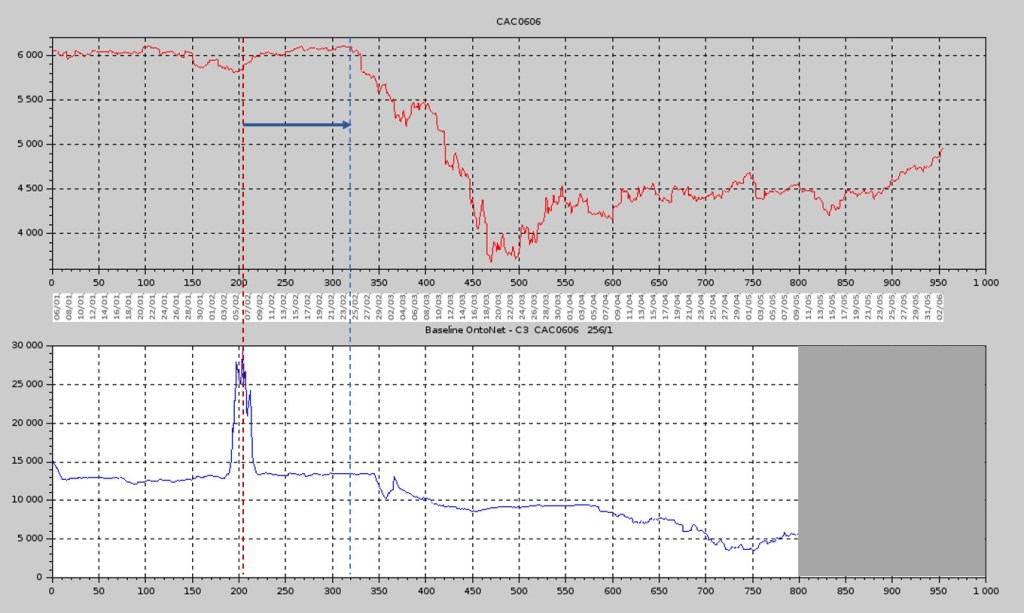
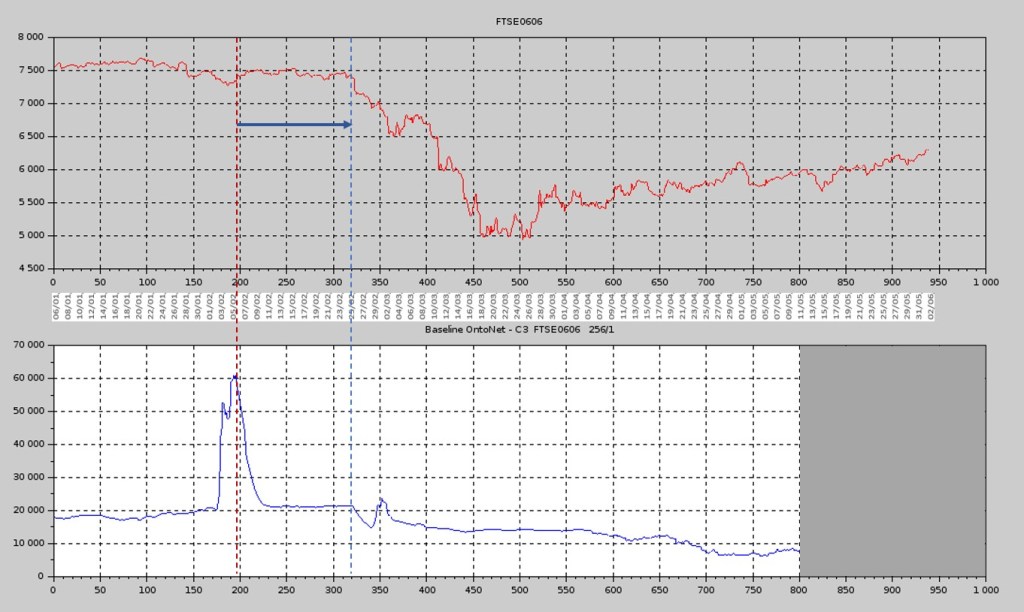
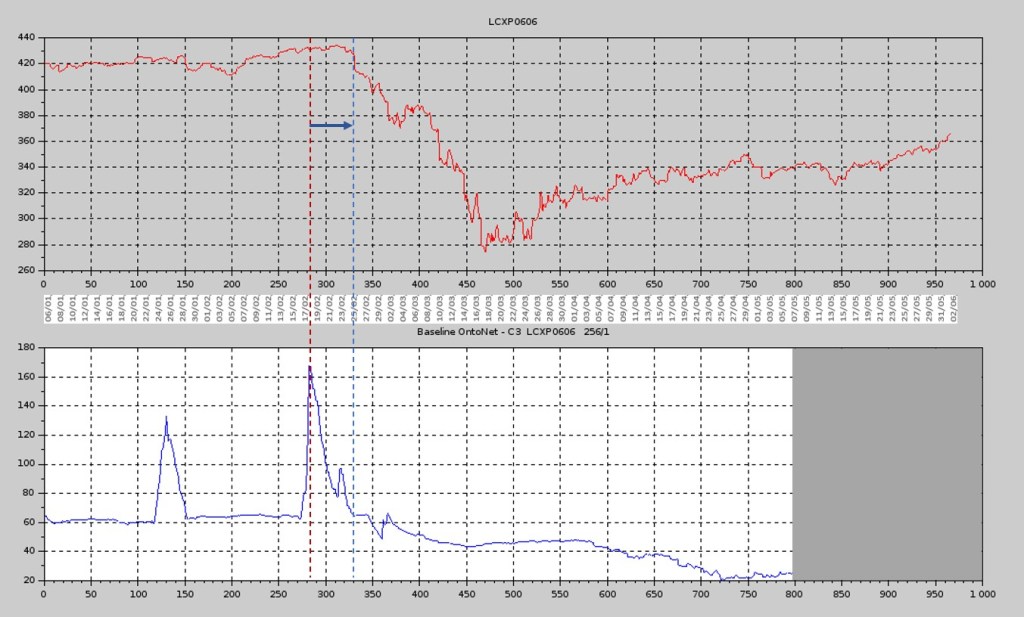
We have devised new complexity-based indices for anticipating Black Swans. One such index, which we call C3, has worked egregiously in major European markets, offering early warnings ranging from 40 to 220 hours before the February 2020 collapse. The analysis was based on the evolution of the market index itself, not its components. Below are the charts of the said market indices together with the corresponding C3 index. The dashed red line indicates when C3 peaks, triggering a shorting signal, while the blue dashed line coincides with the commencing of the downfall. Similar information is very useful in purchasing, for example, put options.
CAC40
DAX30

FTSE 100
EUROSTOXX
For obvious reasons we have grayed out the C3 signal after early May 2020. If C3 peaks again soon we will be looking at a W-shaped crisis. What will it be?

0 comments on “How Complexity Anticipates Black Swans – the 2020 Market Crash”