
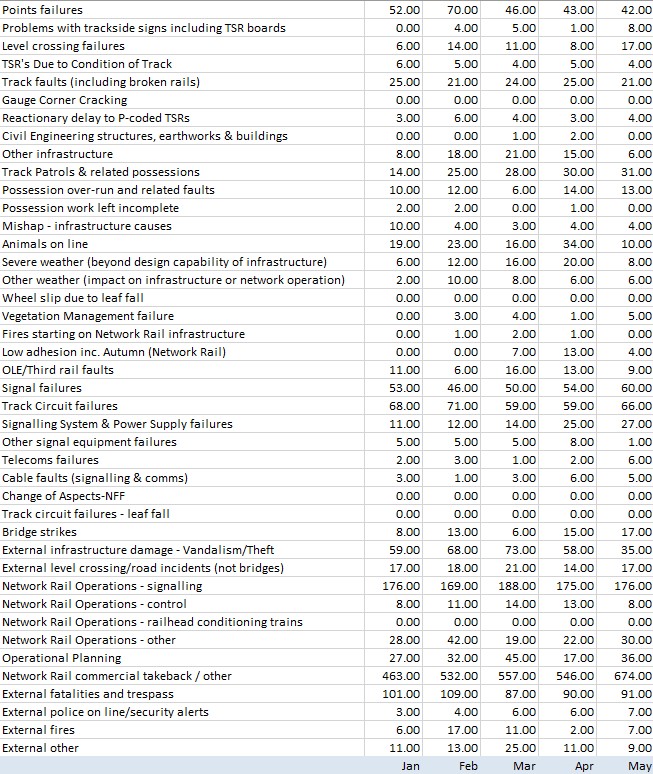
QCM technology allows to make very quick risk and resilience assessments of all sorts of systems of processes. All it takes is data. Data may be sampled over time, space or frequency. Consider, for example, the following monthly data (only a small portion is shown) of failure counts of a railway operation. The data simply reports things like, for example, 19 times animals found on line during the month of January, while in February there were 23, etc. The table is processed using the QCM engine OntoNet.
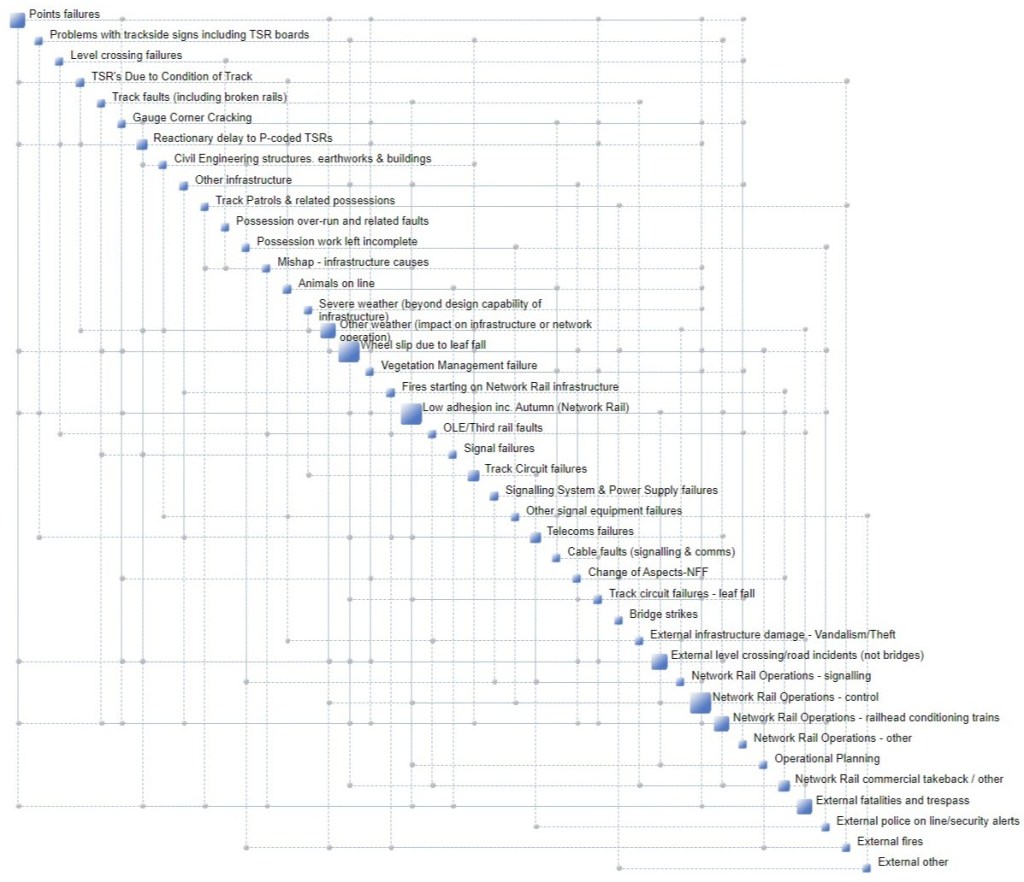
This yields the Complexity Map, which represents the structure of the data, showing which variables are related to which other variables. The variables represented by larger squares are the ones related to more variables than others. Such variables are known as hubs. They drive the resilience and risk of a process or a business. It is crucial to know the hubs of ones business. In large systems, having thousands of variables, many hubs are unknown or are non-intuitive.
The Complexity Profile below shows quickly which variables are critical by ranking them in terms of their percentage footprint on the complexity and resilience of the system in question. The hubs are obviously at the top of the chart. These drive the resilience and risk exposure of the entire operation.
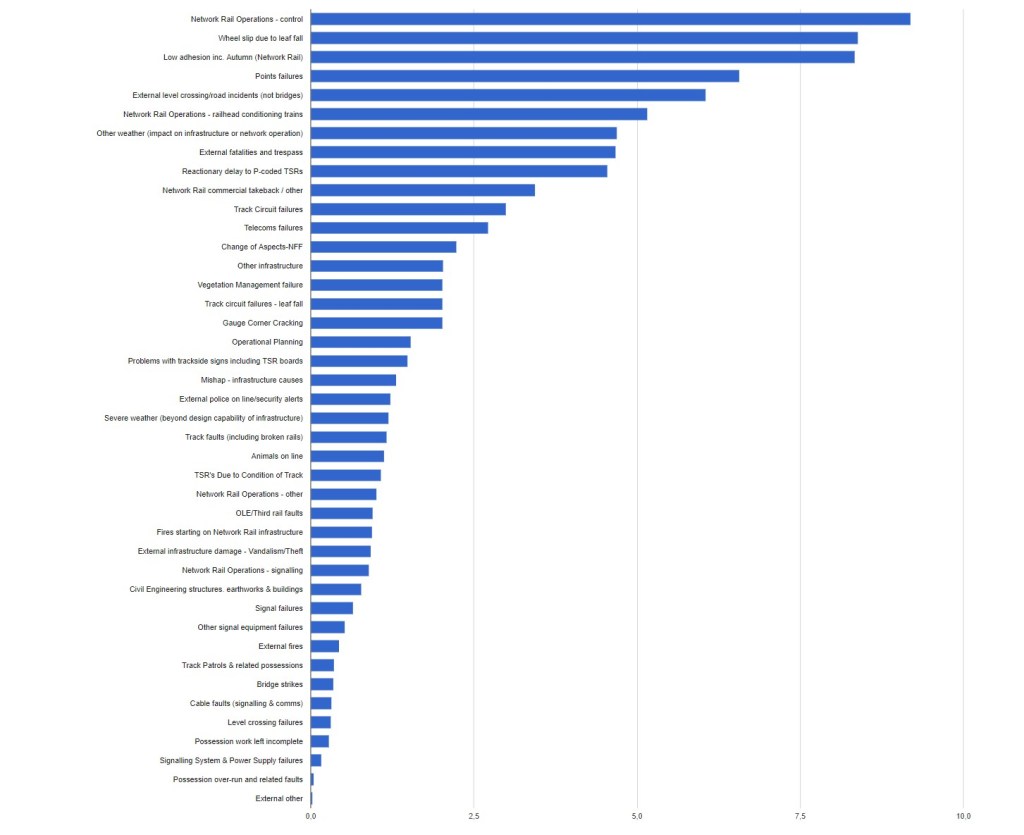
For example, the top 4 variables from the Complexity Profile drive nearly 30% of the resilience of the operation. The main hub – “Network Rail Operations – control” alone is responsible for over 9% of the overall risk and resilience. Since resilience and risk affect punctuality, overall quality of service and, ultimately, profitability, attention of management should be directed mainly at the top half of the Complexity Profile. That’s where the action is.

0 comments on “Complexity Maps of Railway Operations”