
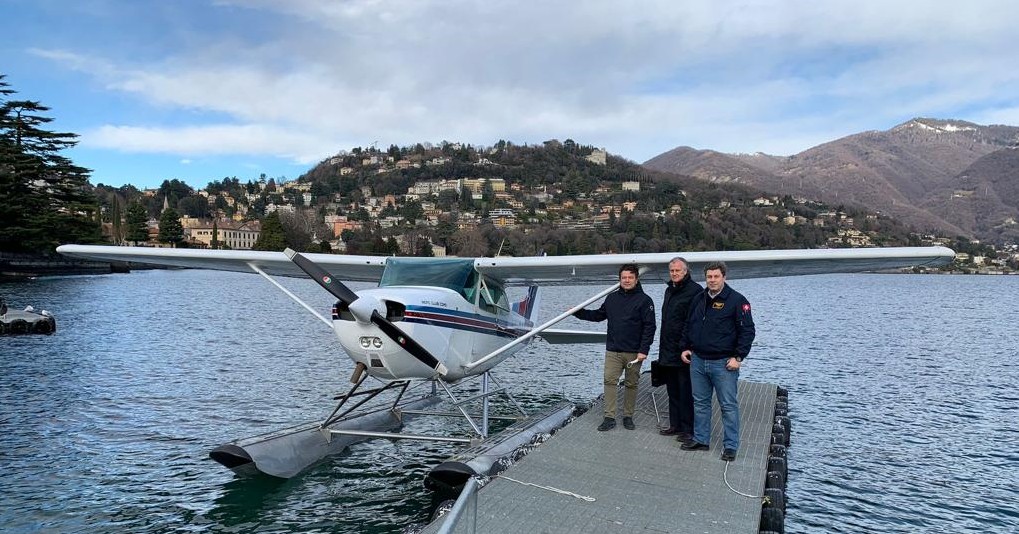
Ontonix and QBT (Chiasso, Switzerland) have performed an experiment in which QCM Technology has been used to measure the complexity of the acoustic and vibration environment onboard an aircraft. The experiment has been performed onboard a Cessna C172 Skyhawk seaplane, at the Aeroclub Como, the oldest seaplane organization and flight school in the world.

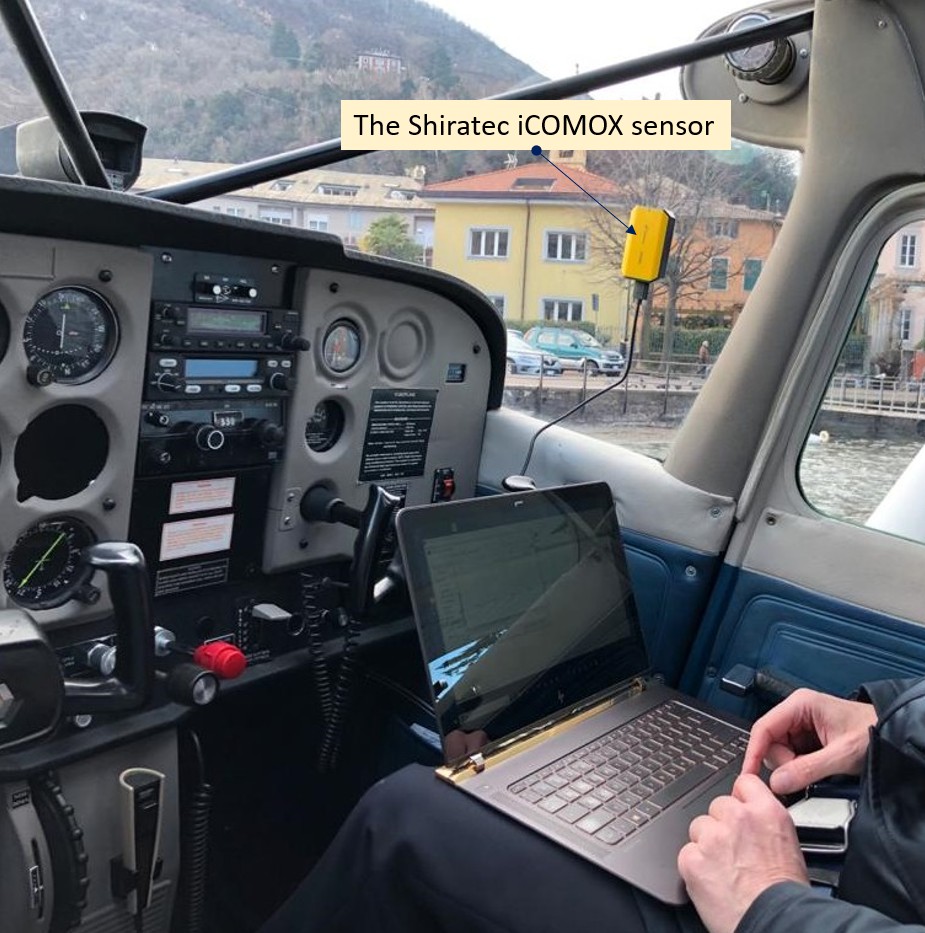
Real-time measurements of the acoustic and vibration environment have been performed using the iCOMOX sensor by Shiratec, our partner. The iCOMOX sensor, visible in the image below, has been attached to a laptop, running the iCOMOX Monitor.
The iCOMOX Monitor screen is shown below, where one may distinguish the vibration and acoustic spectrum, as well temperature and magnetic field spectrum. Output is in Excel format, meaning that interfacing to other applications, such as OntoNet, is very easy.

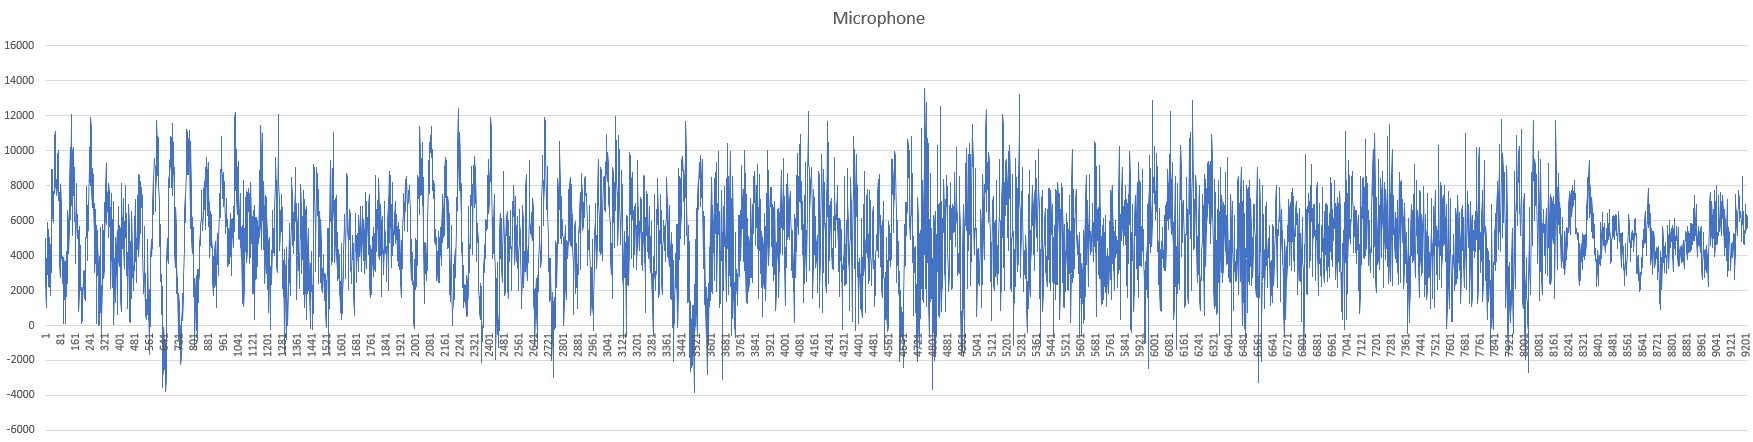
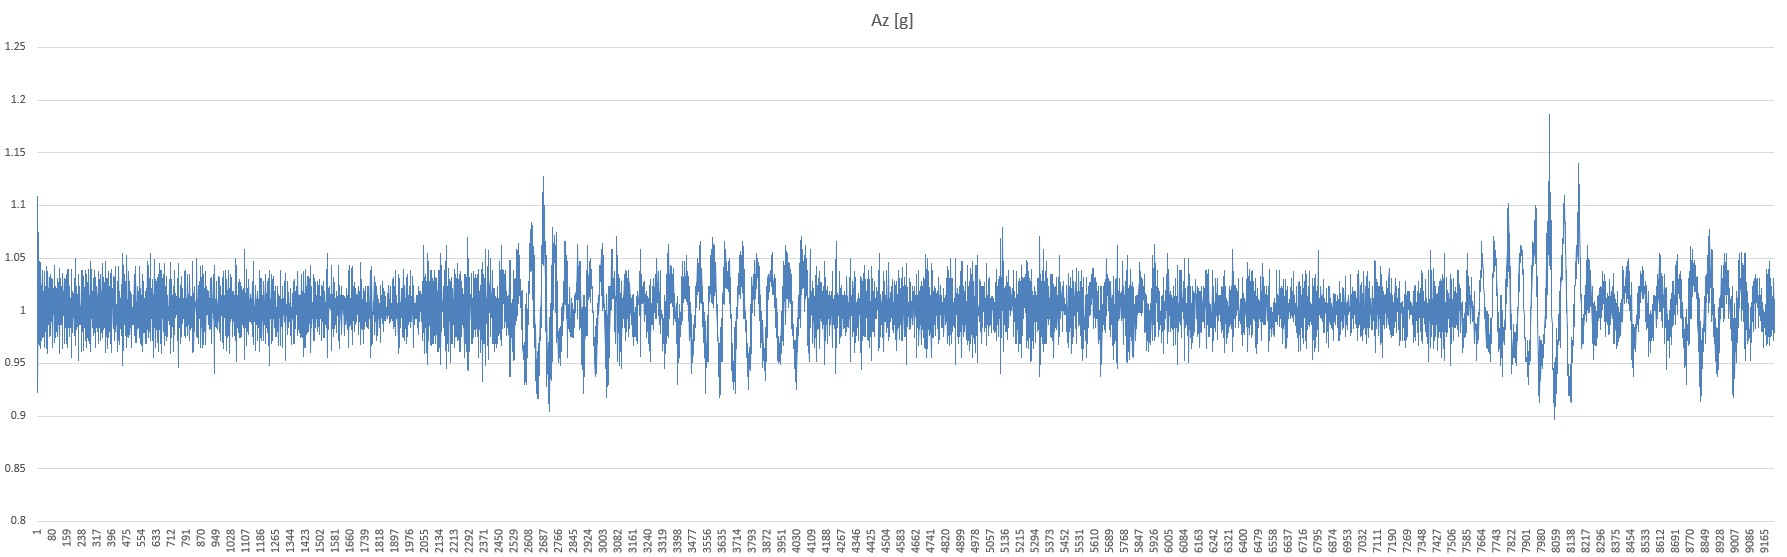
Measurements during various phases of the flight have been made. The microphone and eccelerometer output (vertical acceleration, Az[g]) are shown below. Both records correspond to the last moments of the flight, including the landing. In the microphone plot it is evident how the engine slows down once the plane has landed.
In the acceleration profile one may clearly distinguish turbulence and the final vertical acceleration peaks as the plane makes contact with the water.
The above time histories have been processed using OntoNet, Ontonix’s QCM computational engine. Two complexity metrics have been computed; standard complexity (C), and a modified complexity metric (Cn1), as well as the corresponding integrals over time. Integration allows to measure the ‘total accumlated complexity’, which one could see as ‘total stress’.
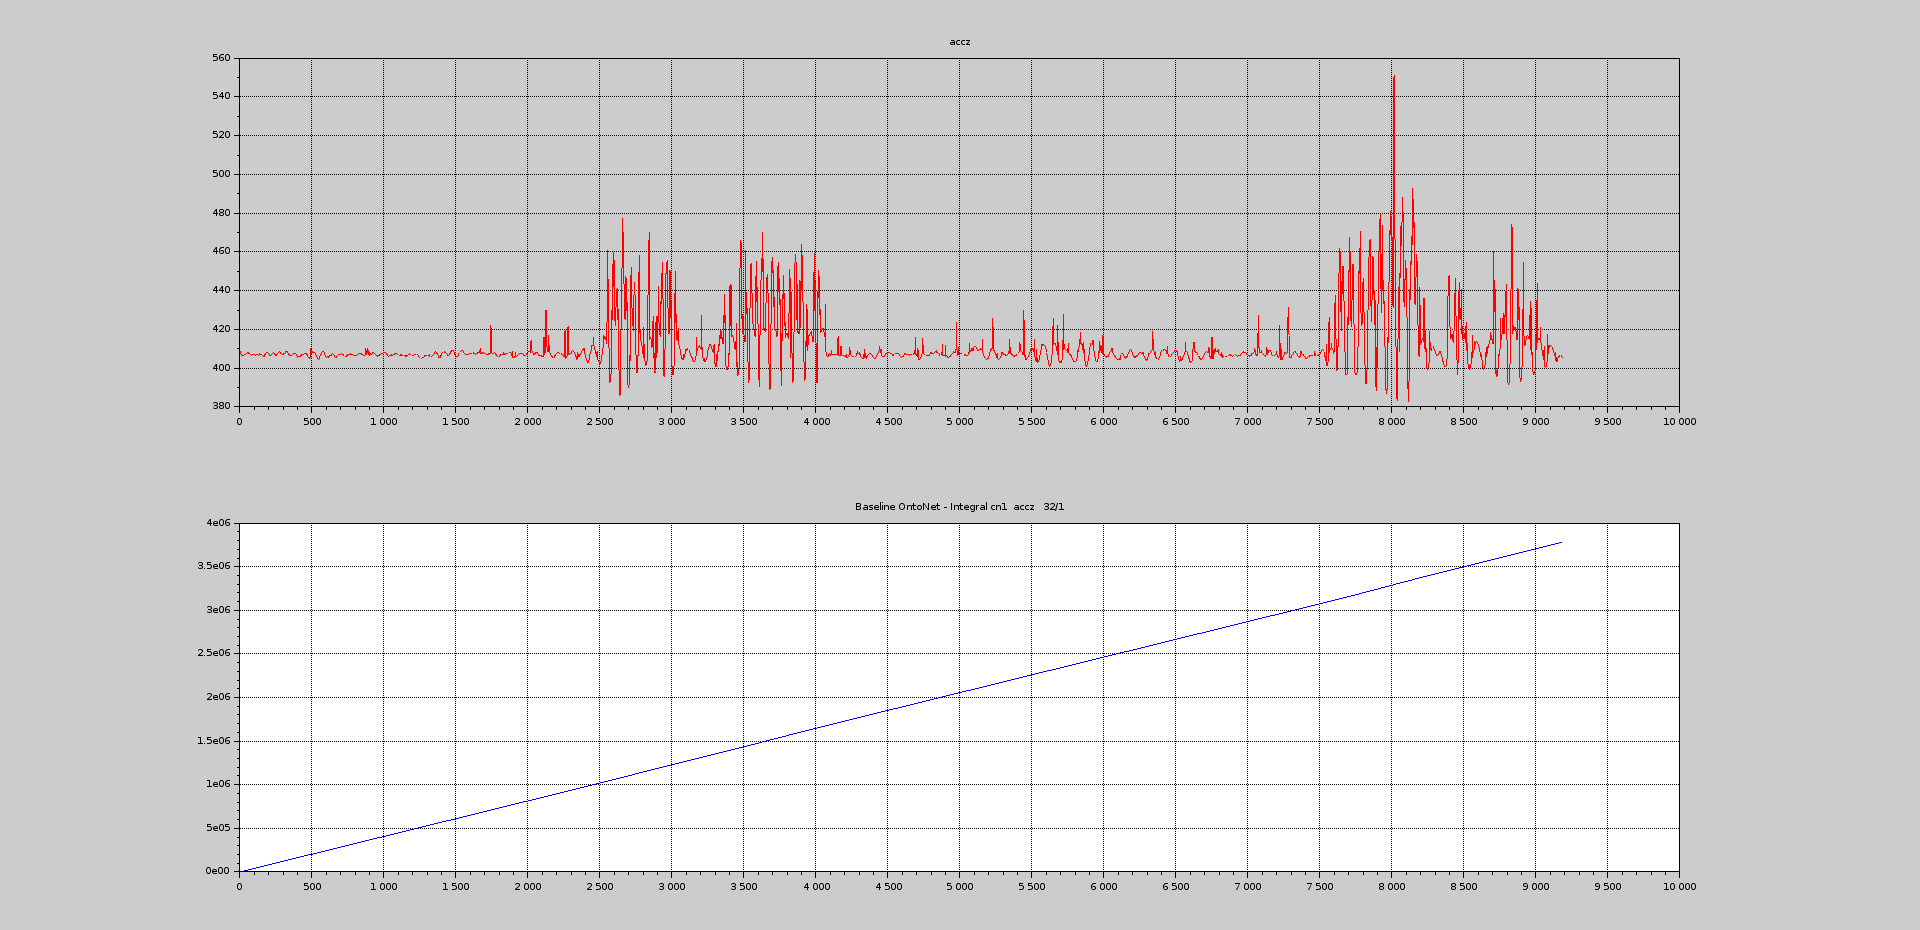
Vibrations
Chart 1: original signal, complexity (C)

Chart 2: complexity (C), integral of C

Chart 3: modified complexity (Cn1), integral of Cn1
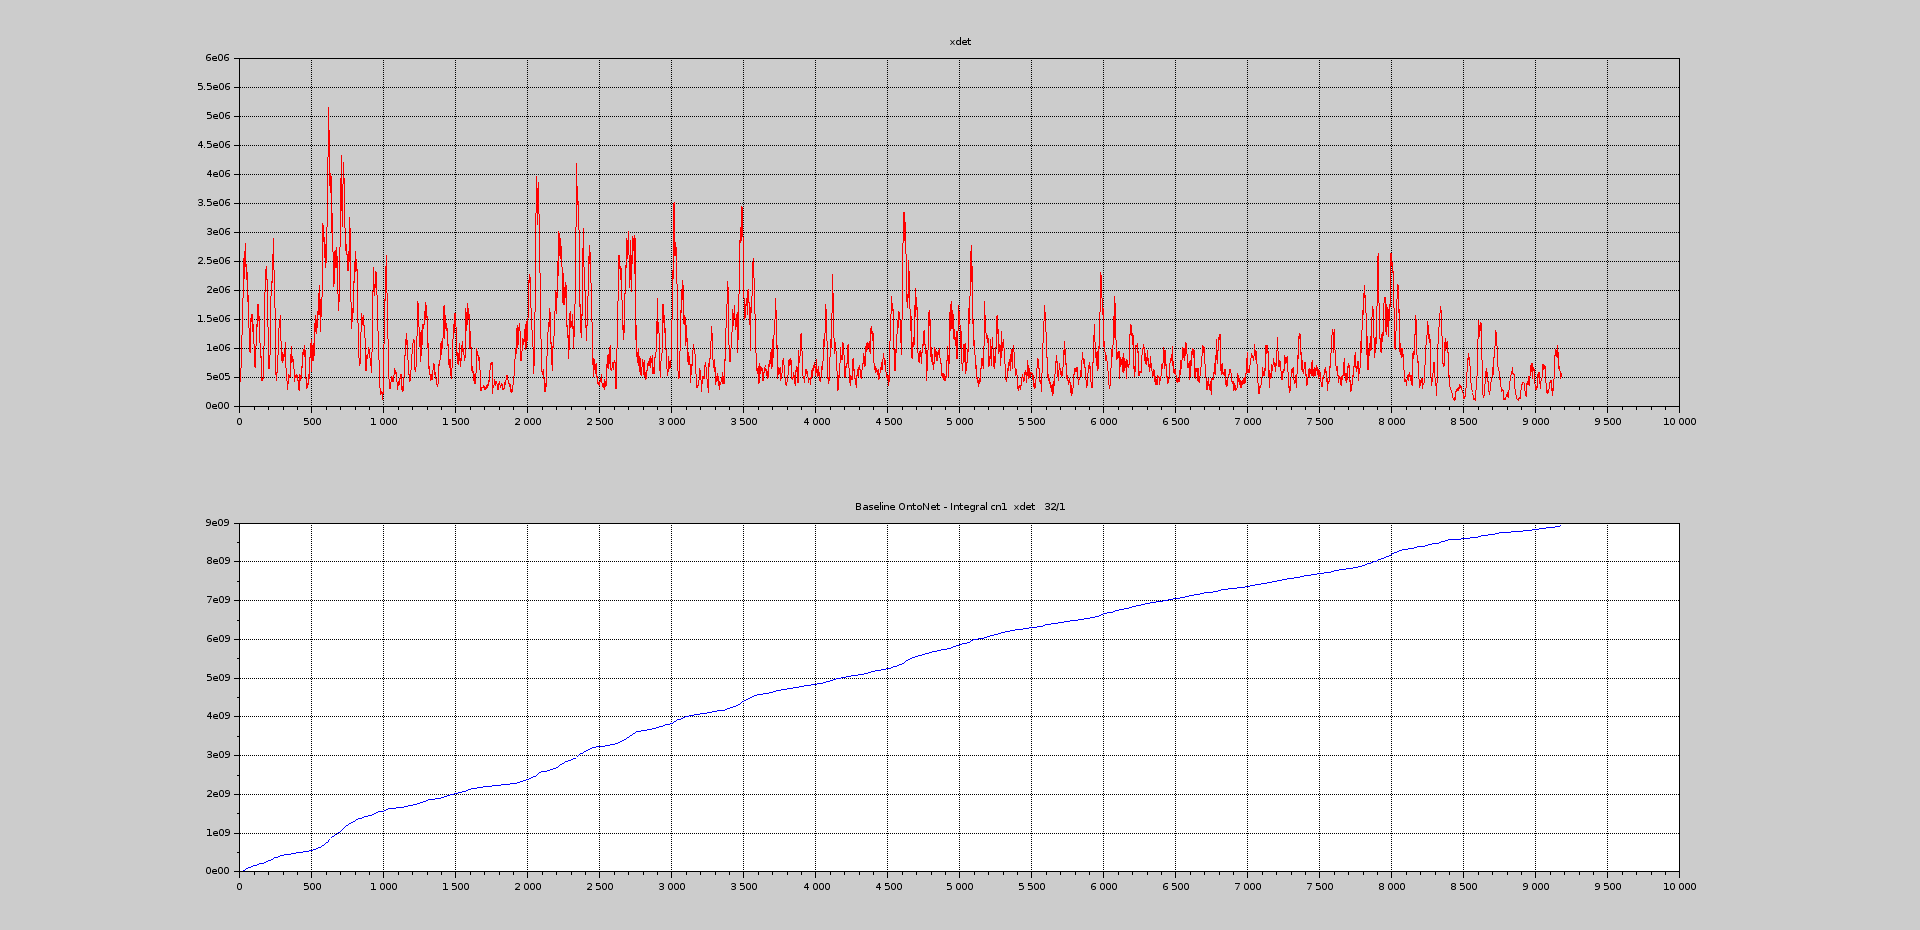
Microphone
Chart 1: original signal, complexity (C)

Chart 2: complexity (C), integral of C

Chart 3: modified complexity (Cn1), integral of Cn1
From the above charts one may conclude as follows:
Vibrations:
mean(C) = 19.7, integral (C) = 185 000
mean (Cn1) = 412, integral (Cn1) = 3.7 e+6
Microphone:
mean(C) = 27, integral (C) = 260 000
mean (Cn1) = .9 E+5, integral (Cn1) = 9.0 e+9
The analysis is still preliminary, however, the above results suggest the following conclusions:
The acoustic regime is more complex than the vibrations. This suggests that, when it comes to measuring the level of comfort in the cabin, in the case in question acoustics prevail over accelerations. Clearly, we’re speaking of a small aircraft with a propeller – a formidable and predominant source of noise – flying in almost calm air. In any event, what produces a more ‘stressful environment’ in an aircraft like the one in question, is more the noise than mild turbulence. Evidently, this is the case because the flight took place on a calm day.
For the above reason, the same experiment will soon be repeated onboard other aircraft, namely Boeing 777 300 ER, Airbus A320, Airbus A350. This will allow to confront various aircraft. A single analysis, as the one described herein, is still quite preliminary.
Once more measurements are available, the two indices, C and Cn1 will be combined to produce a Cabin Comfort Level Index, enabling to compare not just aircraft (in different phases of flight and weather conditions) but also, for example, automobiles. The iCOMOX sensor is ideal for the purpose. It is non-intrusive and installation is almost instantaneous. One can deploy numerous similar sensors throughout a larger cabin, delivering a more comprehensive picture.
One final consideration. The integral of complexity of acceleration (in all three directions) over prolonged periods of time, i.e. years, can be proportional to the total accumulated fatigue of the airframe, hinting in what measure a given aircraft ages. This applies not only to aircraft but to all sorts of vehicles.

Pingback: Complexity and Aircraft Cabin Environment – An Update – Quantitative Complexity Management