
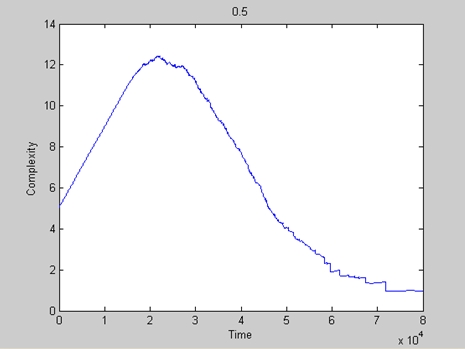
We examine the evolution of complexity of a class of dynamical systems having different dimensions and initial densities of the corresponding Complexity Maps. Each system experiences small and randomly injected increments of entropy.
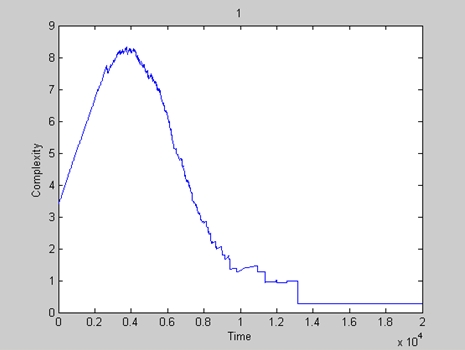
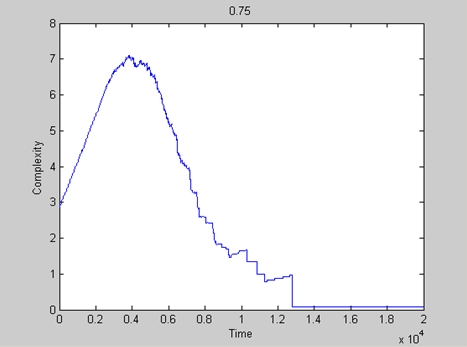
System dimension: 20
Map densities of 1, 0.75, 0.5 and 0.25 are considered.


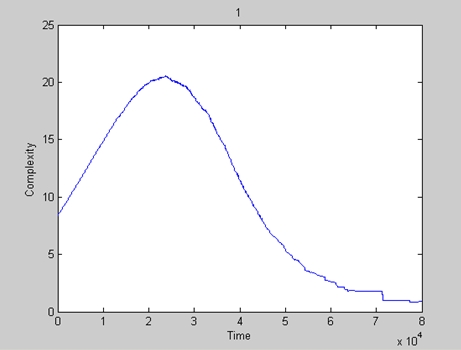
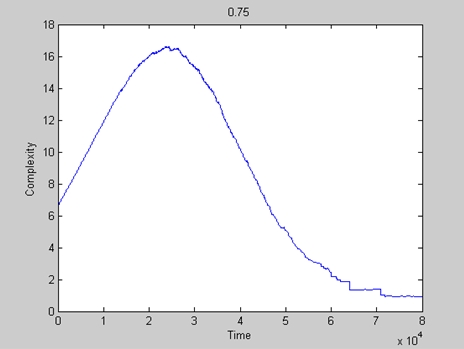
System dimension: 50
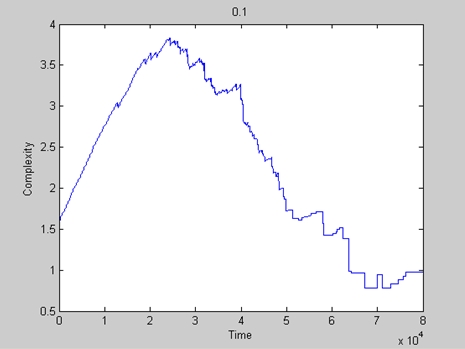
Map densities of 1, 0.75, 0.5 and 0.1 are considered.
The table below provides a synthesis of the results:

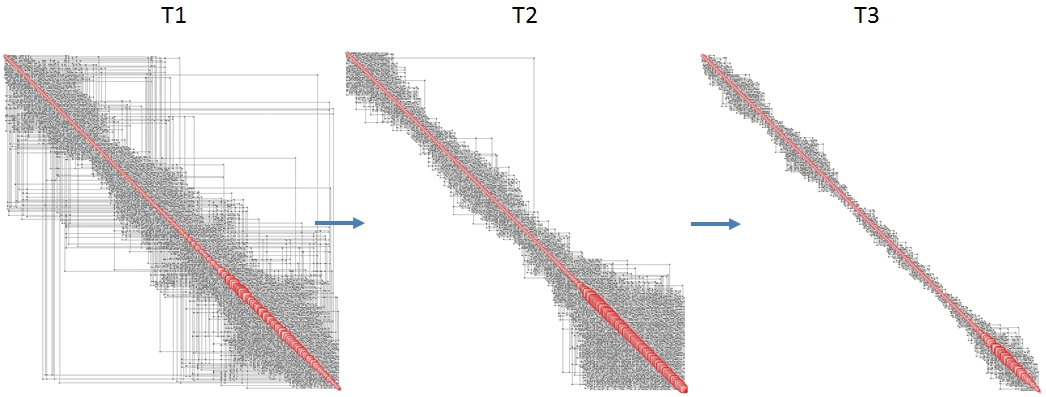
An example of decaying structure is shown below.
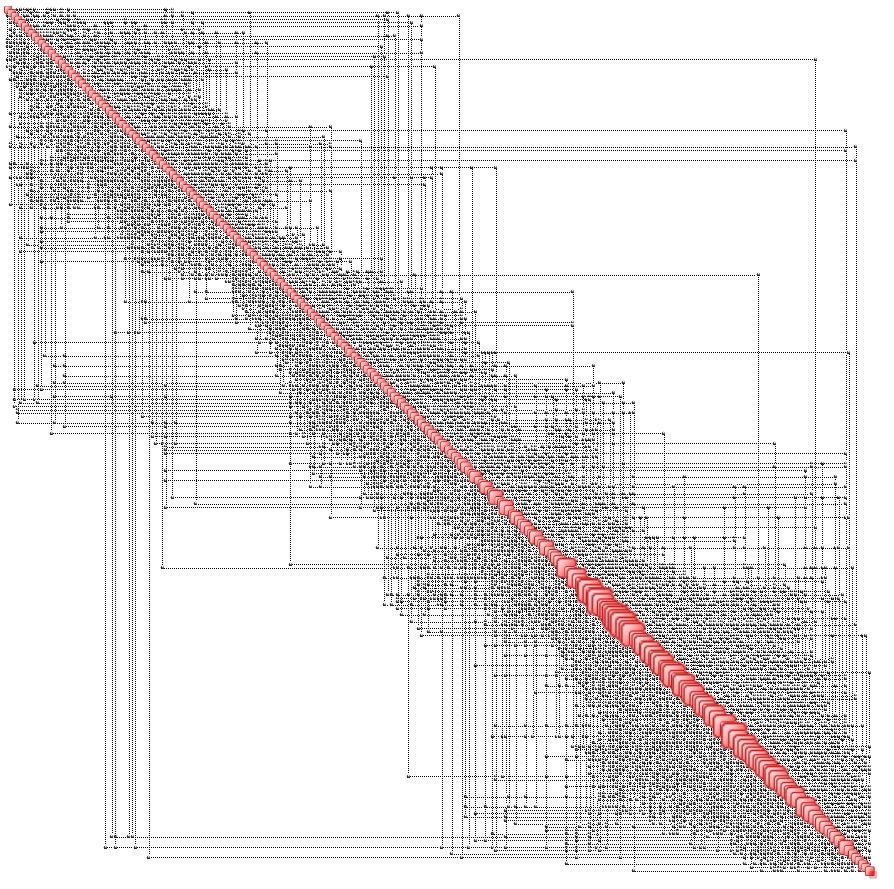
The Complexity Map at T1 – corresponding to peak complexity – is illustrated below. The map has 258 nodes, 8262 rules and a density of 25%.
In conclusion, in all cases it may be obseved that:
- There is a phase in which an increase in entropy increases complexity, this is a period of growth.
- Once peak complexity is reached, a period of decline commences. This is accompanied by loss of structure (Complexity Map density is progressively reduced).
- Decline continues until complexity is zero.
- Higher initial density implies that the system may reach higher peak complexity.
- Lower initial density implies that the system ‘dies’ sooner.
- In low-density systems decline may be ‘traumatic’, i.e. sudden, accompanied by a large loss of complexity.
- Higher initial density implies that the system may be more difficult to destroy.
These findings apply to both natural (biological) as well as man-made systems.

0 comments on “Complexity, Growth and Aging”