
The Resilience Management System is an online tool. It requires data in the form of a spreadsheet. The data should reflect the functioning of your business and can be anything ranging from a Balance Sheet, a P&L statement, cash flow, to sales, an investment portfolio or logistics. It can also be a combination of any of these data.
Data must be organized as shown in the example below, where the columns correspond to weeks months or quarters. There is no specific requirement in this sense.
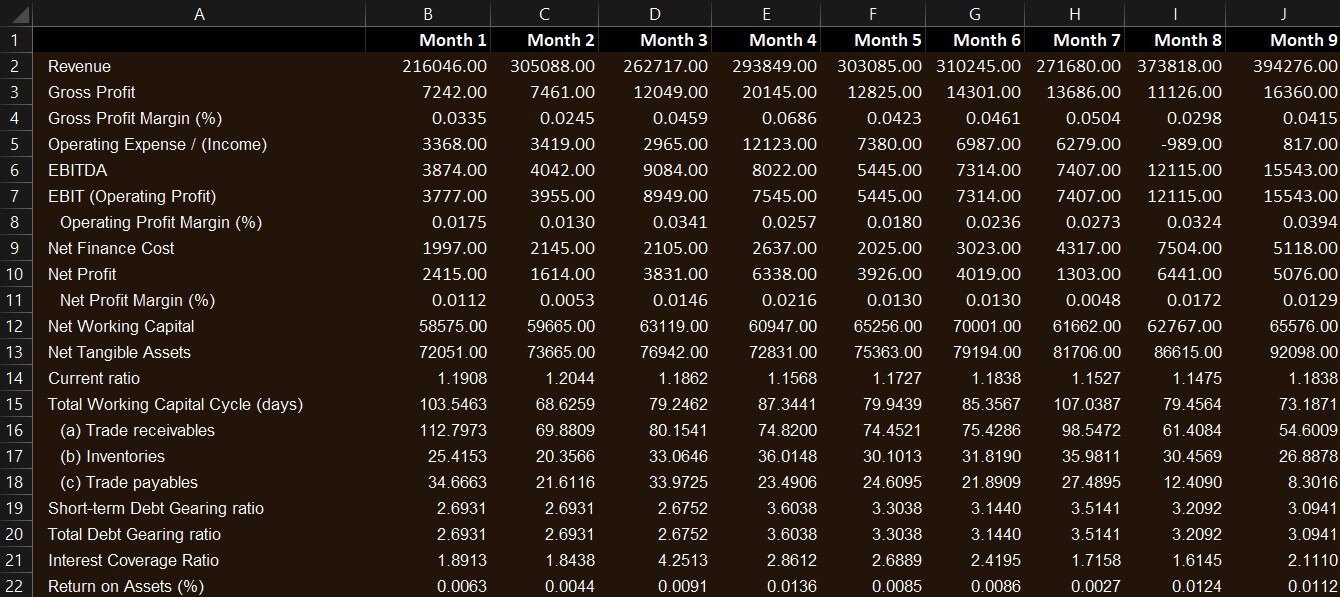
Once you have obtained your credentials, log in and click on START. A spreadsheet window will pop up. Copy (Ctlr-C) and Paste (Ctrl-V) the data into the spreadsheet as indicated by the arrow (cell A1).

The speadsheet should now look as follows:

Click on Proceed. The computations require a few seconds. Two key outputs are produced.
The first is a Resilience Analysis Report, which indicates the Resilience, or Resistance-to-Shocks of your business based on the data you have introduced. In this case it is 74.7%
The most valuable output is a chart showing the impact of each of your business parameters on its overall resilience. In this case, the monthly evolution of the EBIT impacts 15% of the resilience of your business.
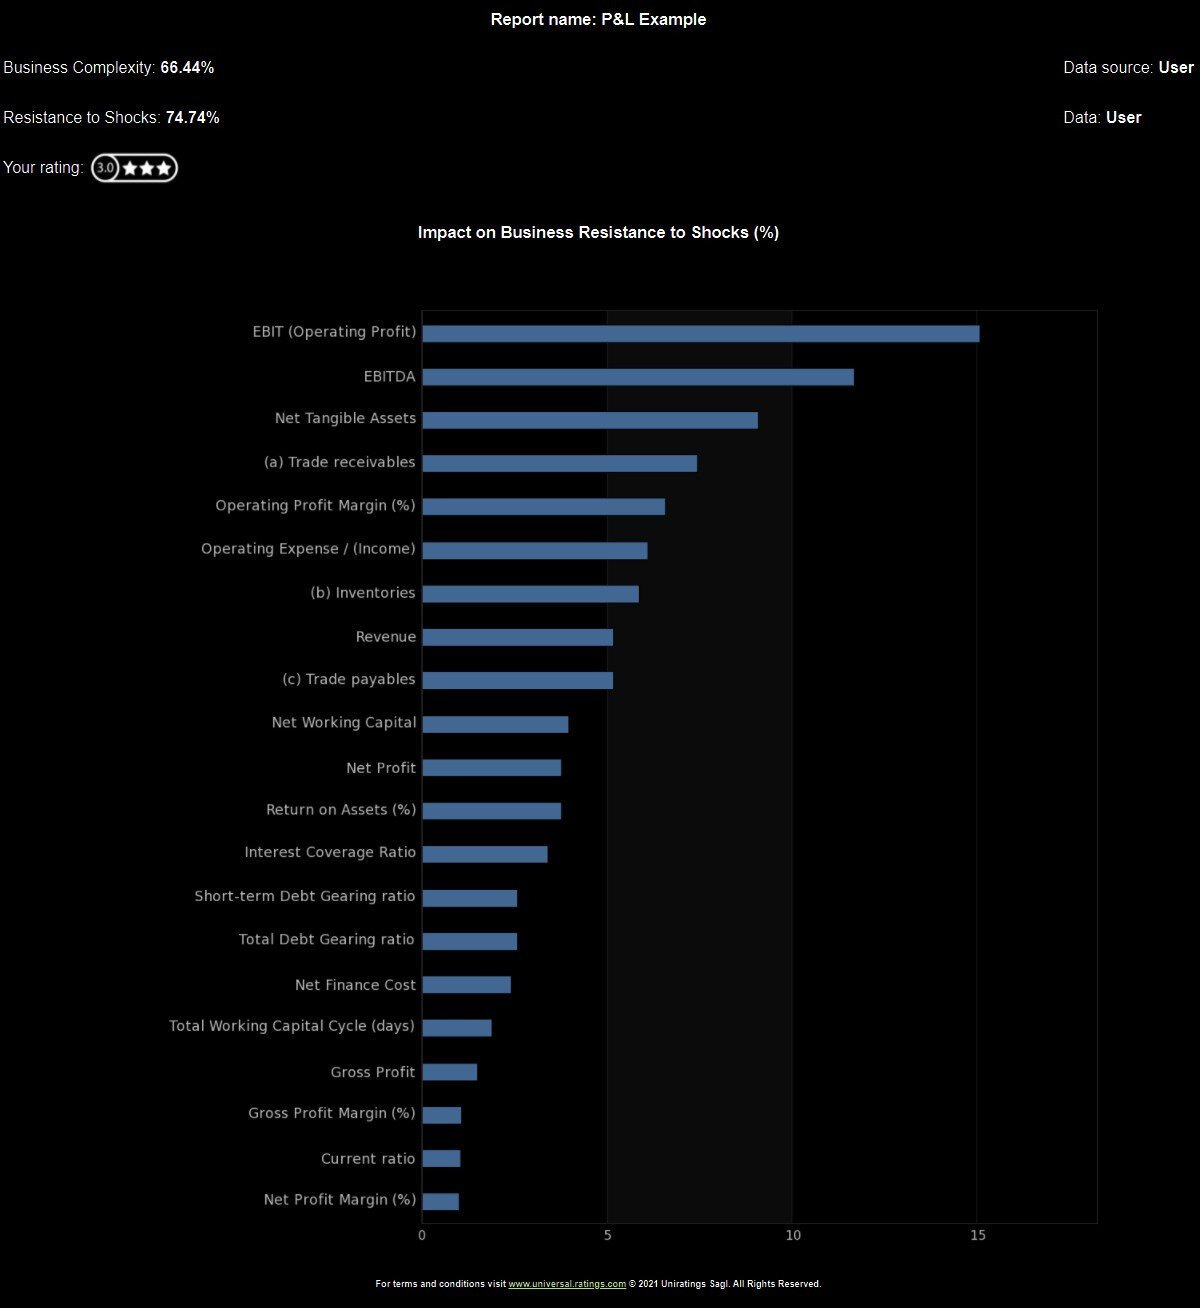
The bar chart shows where to intervene in order to improve the State Of Health of your business. Evidently, one would start with the parameters at the top of the chart, as they have more impact.
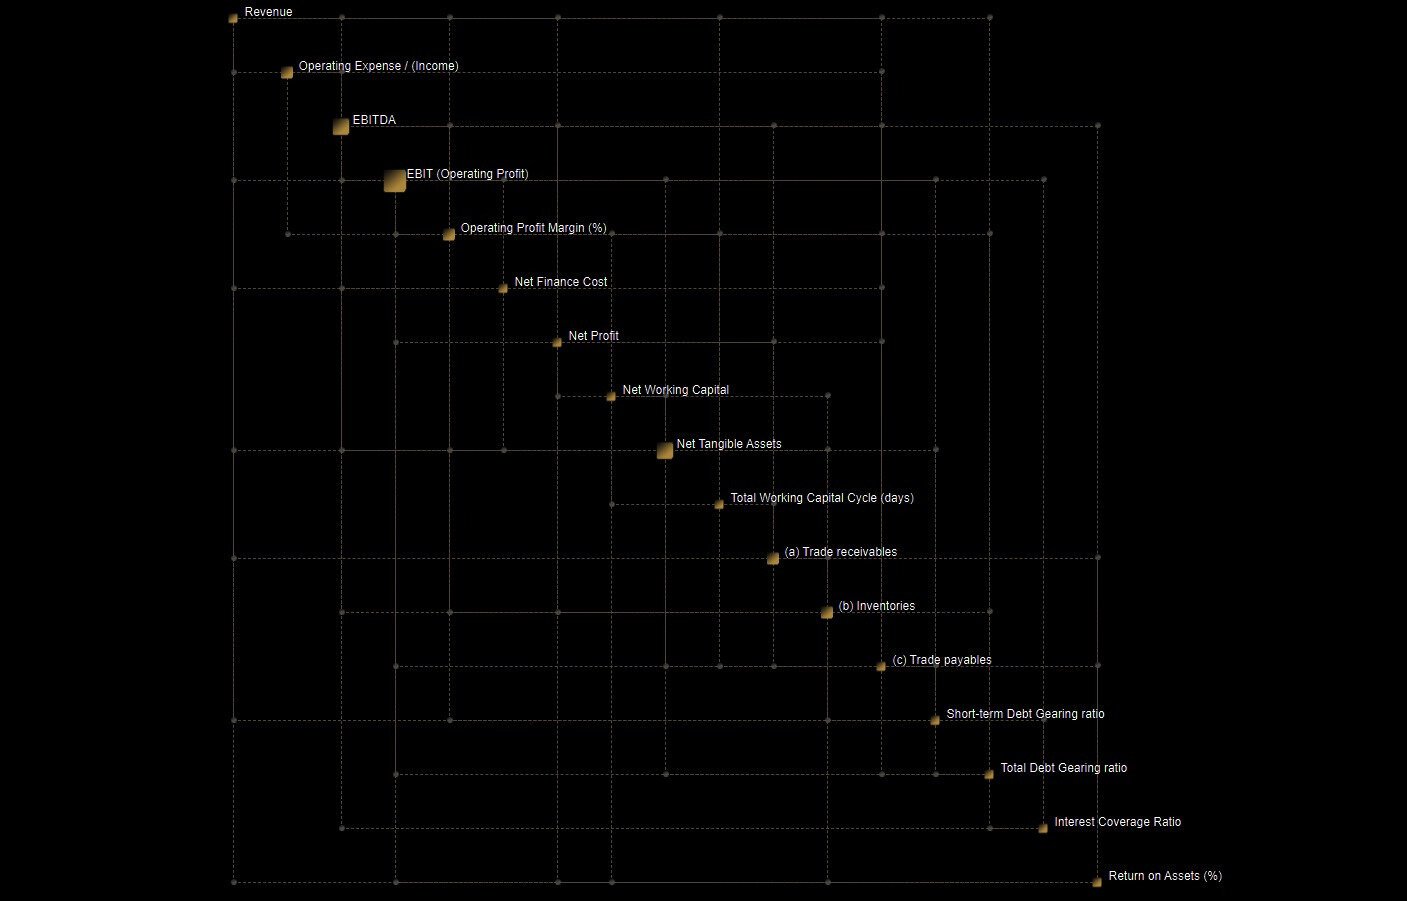
A second output is a Business Interdependency Map, showing how business parameters are related to each other. Analyzing this map – which may be navigated interactively – allows one to understand more intimately how a business functions.
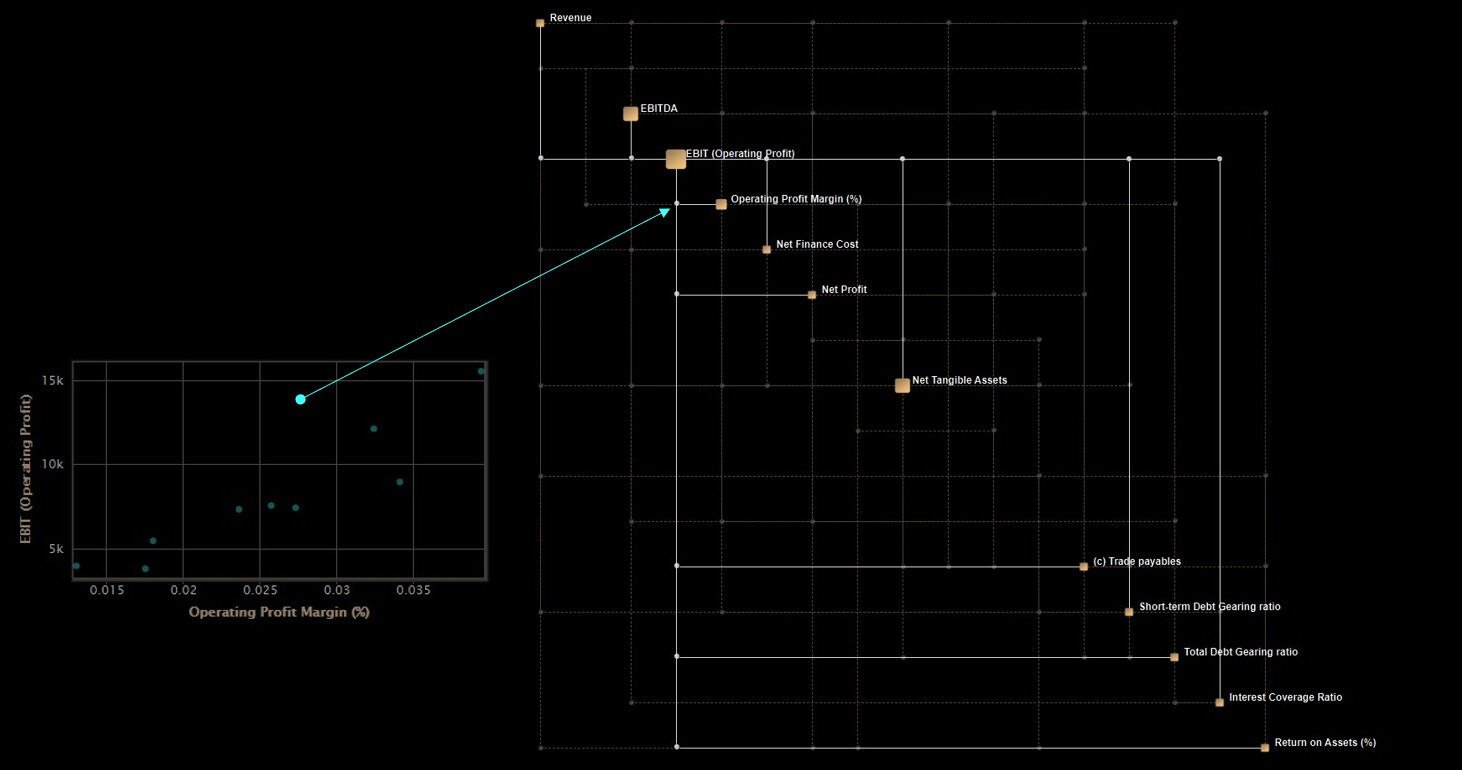
Clicking on “EBIT” shows why it drives resilience – it is interdependent with a multitude of parameters. The dots joining the edges of the map represent the said interdependencies. An example is shown (EBIT versus Operating Profit Margin):
You can experiment with Interactive Maps by clicking on the examples below.
The following are examples of stock portfolios built on major indices. Maps may be navigated by clicking on stocks – boxes on the diagonal – or on the off-diagonal links (grey bullets), in order to understand the nature of their respective interdependencies.
GFCI Global Financial Complexity meta-index
Contact us if you are interested in webinars and courses on the usage of the Resilience Management System.

0 comments on “Test the Resilience of your Business or Portfolio. Get a Rating.”