
Quantitative Complexity Management (QCM) technology has been applied to a very wide variety of data types and sources. In this short blog we illustrate the application of QCM to real-time processing of streaming vido. This is how it works:
- Video is split into frames. The frequency of this depends on the nature of the application (military, surveillance, medical, satellite imagery, traffic, etc.).
- Each frame is processed so as to prepare it for QCM. Basically this is equivalent to transforming an image into a n x m pixel map in ‘csv’ format (coded by LPG).
- QCM processes the pixel map and complexity measures at step i are saved.
- Sudden complexity variations may be used to identify the emergence of anomalies or anomalous features.
- The process is repeated as necessary.
As small example is illustrated below. Watch video in Youtube.

The 16-second video is split into over 150 frames, separated by 100 msec. The above procedure produces the following complexity evolution over time.
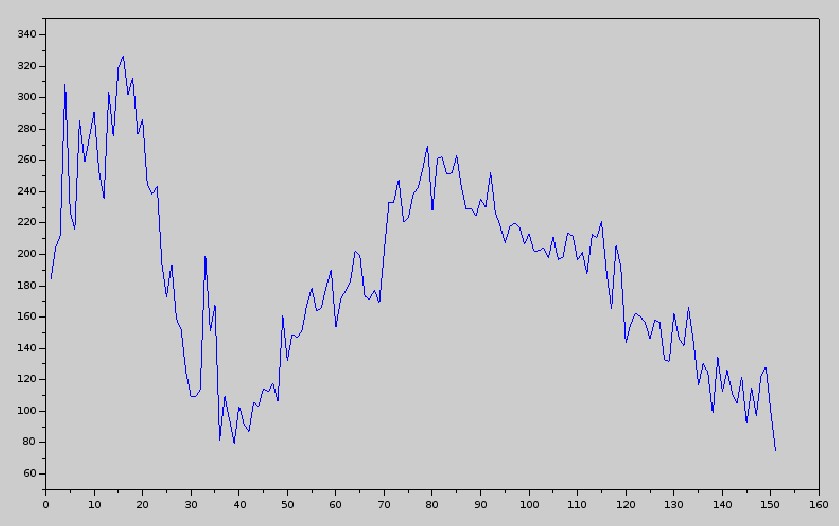
It is interesting to note that, apart from the leftmost peak, which happens because of the large white disk, the rightmost image is not the most complex, as illustrated below.
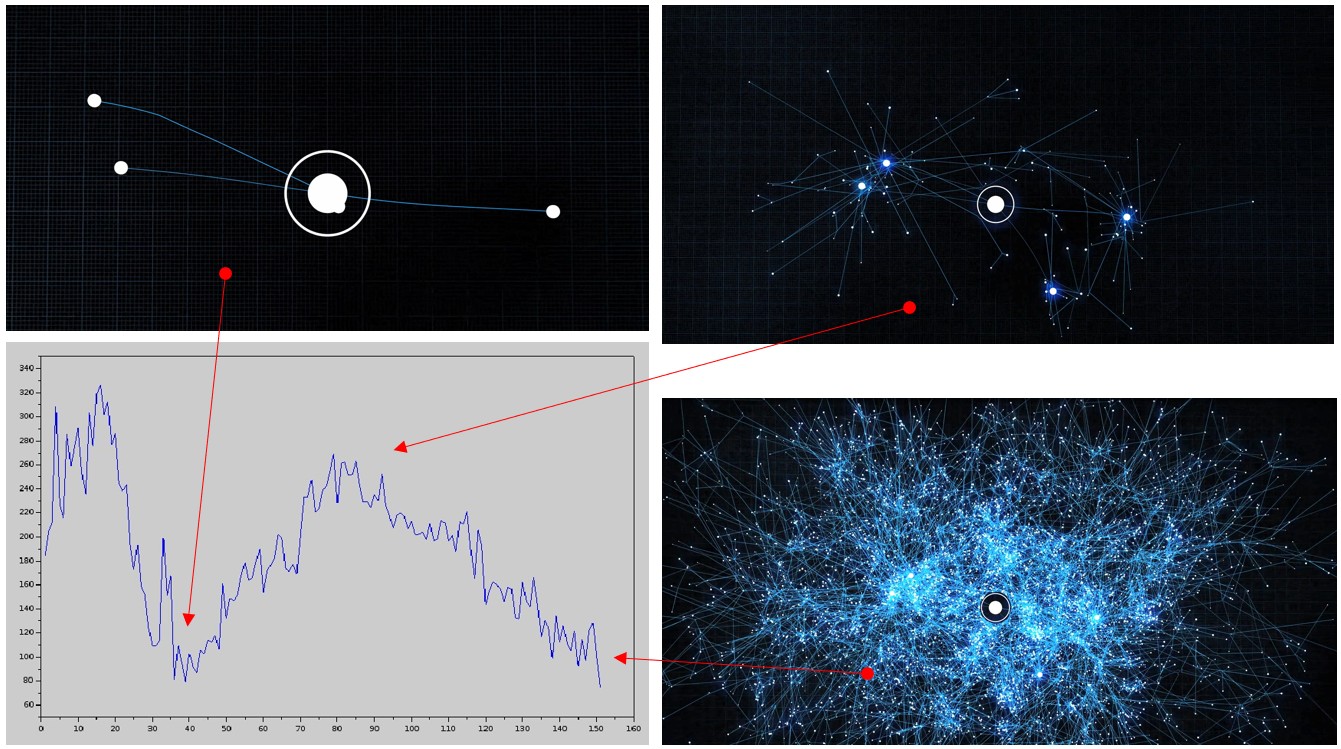
This is because complexity is structured information and the image in question is so chaotic as to transmit very little information. In fact, the peak in complexity is attained approximately half-way through the video. This may seem counterintuitive, but then, complexity works in mysterious ways!

Pingback: Image Complexity as Proxy of Traffic Density – Artificial Intuition