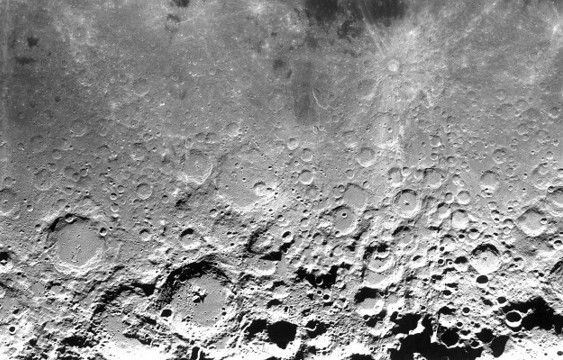
Recently revealed analysis of NASA’s Lunar Reconnaissance Orbiter (LRO) data has delivered images of unseen quality. The images of the Moon’s terrain made possible by the Lunar Orbiter Laser Altimeter (LOLA) instrument onboard the LRO has been compared to similar images obtained using the Unified Lunar Control Network based on the best available data at the time, including imagery from the Clementine, Apollo, Mariner 10, and Galileo missions as well as Earth-based observations. Two images, one from 2005 (left) and 2010 (right) are confronted and analyzed using OntoSpace. The idea is to measure their complexity and entropy.
The idea, however, is to measure the “distance” between these two images. How is this done? Quite simple. Complexity measures the total amount of structured information. This is expressed in bits. Based on the complexities of the two images (177.80 in 2005 and 203.66 in 2010) we can measure the increase in information to be around 14%. You can also see that since the entropy of the image in 2010 is lower than that of the 2005 image (down to 23411.02 from 26304.82) the image is also sharper.
However, the interesting experiment is to actually compare the topologies of the two Complexity Maps (see above picture) as this will yield the true amount of “total difference” between the information conveyed by the two images from the perspective of structure. For this purpose we use OntoBench, our complexity-based benchmarking tool. We normally use it to compare bank branches, financial products or corporations. However, since an image may be transformed to a rectangular array, and since OntoBench compares two rectangular arrays of equal size, the tool may also be used to analyze pairs of images. The result is as follows:

Complexity Data Set 1 (Moon_2005_001): 177.80
Complexity Data Set 2 (Moon_2010_001): 203.66
Data Set Similarity: 95.76 %
In other words, since the similarity between the two images is 95.76%, the global increase in information obtained is 100 – 95.67 = 4.33%. This result is not in contrast with the previously mentioned 14%. Because the 2010 image is sharper it reveals smaller details. However, these details are quite small and they do not alter the topology of the global pattern which, in both cases, is essentially the same.

Pingback: Ontonix Develops Rotation-Invariant Image Complexity Analysis – Artificial Intuition