

Why over 90% of projects finish late? There is plenty of literature on the subject. This is a good example. In multi-project environments, such as the one illustrated below things can get very complex as project share resources (financial, manpower, equipment, etc.).

When it comes to project costs, similar statements can be made. American Planning Association in 2002 found that 9 out of ten construction projects had underestimated costs. Overruns ranged from 50% to 100%. Some illustrious examples:
- Suez canal: effective cost was 20 times the original estimate
- Sydney Opera House: 15 times
- The Concord: 12 times
Other well-known examples: the F-35 fighter, Denver International Airport, Airbus A380, Boeing 787, Humber Bridge, Channel Tunnel, Berlin Brandenburg Airport.
Again, there is plenty of research on the subject and in general the following three causes are indicated: technical, psychological, and political-economic. In general, it comes down to poor risk analysis.
In this short blog we wish to focus on a particular technical aspect of risk analysis, especially when it comes to cost control. This is how a typical risk analysis works:
- A project schedule is assumed – this produces the Gantt chart
- Randomness is added to the various tasks, milestones, costs, etc.
- A Monte Carlo realization of the project is executed thousands of times
- The results are processed statistically in order to determine probabilities, expected values of cost and deliver time, etc.
The cost of a project is equal to the sum of component costs:
C_project = Cost_1 + Cost_2 + …. + Cost_N
In the Monte Carlo process, randomness is added to each of the component costs and thousands of realizations are executed. The first problem is how this randomness is modeled. There exist many probability distributions to choose from. In general, ‘expert opinions’ or conjectures are used to determine which distributions will be used.
However, the most fatal and, unfortunately, the most common mistake in Monte Carlo simulations is to ignore dependencies between the inputs. In other words, if, Cost_i and Cost_j are correlated, ignoring this correlation changes things pretty dramatically. Imagine what damage this can cause when thousands of component costs are considered. Computing project costs by simply summing up component costs and neglecting their inter-dependencies is a good example of anachronistic linear thinking. The most common excuse is: these inter-dependencies are awfully difficult to determine. So they are neglected. Once more, men become slaves of their tools and reality is bent to satisfy the said tools.
Basically, the above model should be:
C_project = Cost_1 + Cost_2 + …. + Cost_N + Nonlinear (coupling) terms
The nonlinear part is of course neglected.
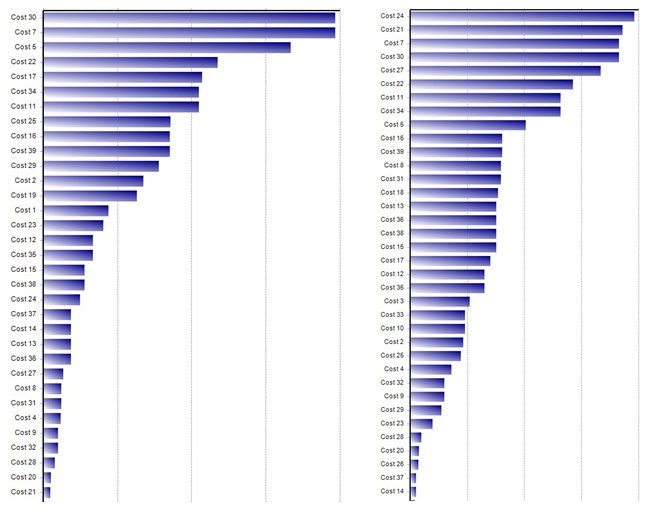
An example of how neglecting the mentioned cost inter-dependencies impacts the resulting Tornado Chart (which ranks the component costs in terms of correlation with the total project cost) is:
If that were not enough, correlations between the total cost and component costs are often over-estimated as pointed out in our previous blog.
The reasons why most projects are late and incur cost overruns are many. Lack of Project Complexity Management is certainly one. The objective of this blog, however, is to point out that, independently of political and psychological issues, seeing reality as linear while it is not, induces distortions with guaranteed adverse consequences on estimates of costs, schedules or probabilities of failure.

My doctoral thesis deals with the subject overrun costs. It was published by the Court Portuguese
I did Multimpact model that makes the prediction of financial slippage based on the historical behavior of the agents involved.
Click to access 47ndx.pdf
This thesis is organized in three parts, reflecting three kinds of Reasons: the
complexity and uncertainty about the nature and singularities public work, the
Those aspects of influence on the cost variation, and finally the proposal and use of
the forecast model – the Multimpact model.
Summarizing, this thesis presents the main conclusions Following:
a) The development of a concept model, able to link cost variation and its
causes;
b) The cost variation can be described by the statistic exponential distribution
c) The proposal of a model operating – Multimpact, connecting aspects of the
management quality, the complexity and uncertainty associated with the
project and the cost variation;
d) Proposal of procedures having in view cost variation minimization.
LikeLiked by 3 people
Is your thesis available in English?
LikeLike