In a 2015 United Nations Trade and Development Conference report “Trade Slowdown” one reads:
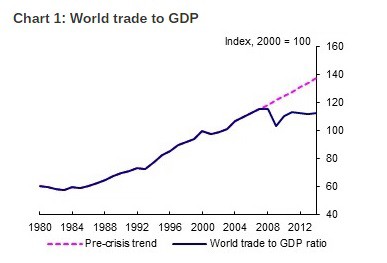
The curve goes flat approximately 1 to 2 years before the 2008 economy meltdown.
As we have indicated in past blogs, a system which evolves and grows becomes more complex. A good example is that of our biosphere, wherein the evolutionary thrust produces increasingly complex structures and life forms. The same may be said of the economy, in particular of the Global Economy.
The opposite happens when ecosystems or economies (societies) face catastrophes such as mass extinctions or wars and depressions. A dramatic loss of biodiversity (such as the extinction at the end of the Permian period, which wiped out 96% of the species – all life on Earth today descends from the 4% that survived) leads to a significantly simpler biosphere. In the economy, the crises of 1929 and 2008 are good examples. Loss of activity and vitality (development, progress, trade) is equivalent to a loss of complexity (de-globalisation). This is clearly visible in the chart below where we report the above chart as well as the evolution of Global Complexity since 1980 until 2015.
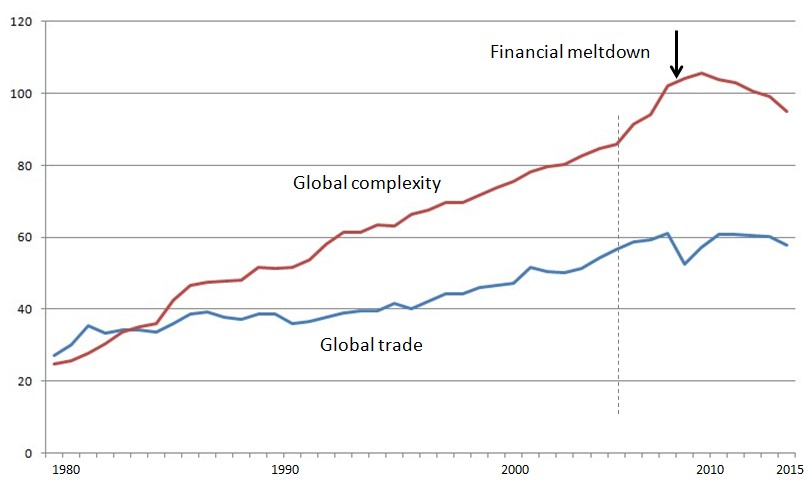
The 2008 crisis is indicated by the vertical arrow. After peaking in 2009 global complexity falls at an almost constant pace, accelerating visibly at the end of 2014 (just like global trade, which drops after a period of 4 years of constant value).
One can make following interesting observations:
- Approximately 3 years before the 2008 financial meltdown the complexity gradient has increased significantly (to almost double the value of the preceding 10 years of steady linear growth). The hump, which peaks in 2009, is what we call a ‘complexity bubble’. Bubbles are of course made to burst.
- The rapid increment of the complexity gradient precedes the slowdown of global trade by approximately 1 year. Similar phenomena may be observed around 1985-86, when a sudden jump in complexity preceded a stagnation of global trade until 1990.
- If we examine the global complexity trend since 2009 we witness an evident and sustained reduction. This is not a good omen. It means that, globally speaking, we are not on any road to recovery. Quite the contrary, we haven’t touched the bottom yet. If we accept that globalisation, global trade and global complexity are related, the complexity chart in particular shows eloquently that the system is still ‘shrinking’.
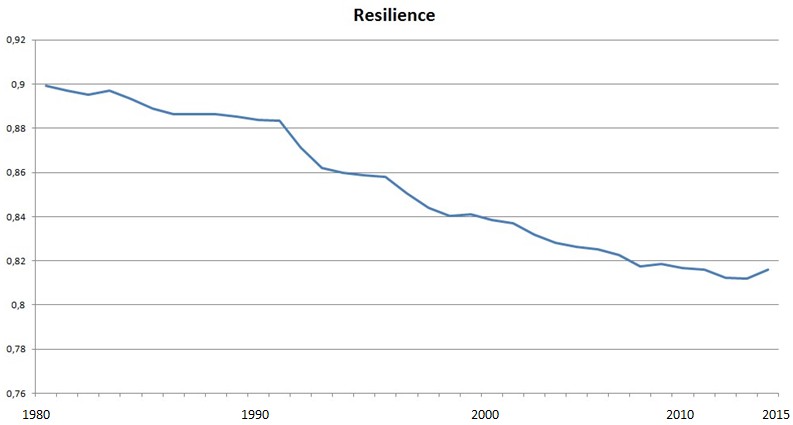
The one piece of good news is on the resilience front. In the chart below it is shown how global resilience, which has dropped by almost 9% in the period 1980-2010, is now showing signs of mild recovery. This means that, based on the available data, the World seems to have experienced its maximum fragility around 2012-2013.
In summary, complexity, provides a new KPI which naturally blends thousands of indicators into one and which allows us to anticipate, reflect and measure the trends and traumas in the economy from a holistic and systemic perspective.
It is interesting to dispose of similar information (complexity, resilience) together with a quantitative breakdown into the 1400+ factors which the World Bank provides, for each of the 194 countries. This is exactly what we provide in our “Global Complexity Report” – a modern tool for the global investor.
For information contact us at info@ontonix.com

0 comments on “Will Global Trade Recover Anytime Soon?”